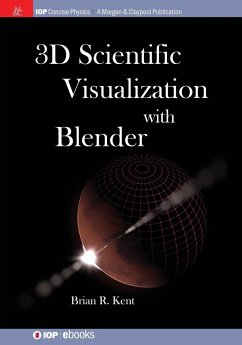
This is the first book written on using Blender (an open-source visualization suite widely used in the entertainment and gaming industries) for scientific visualization. It is a practical and interesting introduction to Blender for understanding key parts of 3D rendering that pertain to the sciences via step-by-step guided tutorials. Any time you see an awesome science animation in the news, you will now know how to develop exciting visualizations and animations with your own data. 3D Scientific Visualization with Blender takes you through an understanding of 3D graphics and modeling for different visualization scenarios in the physical sciences. This includes guides and tutorials for: ¿ Understanding and manipulating the interface ¿ Generating 3D models ¿ Understanding lighting, animation, and camera control ¿ Scripting Data import with the Python API The agility of Blender and its well organized Python API make it an exciting and unique visualization suite every modern scientific/engineering workbench should include. Blender provides multiple scientific visualizations including: solid models/surfaces/rigid body simulations; data cubes/transparent/translucent rendering; 3D catalogs; N-body simulations; soft body simulations; surface/terrain maps; and phenomenological models. The possibilities for generating visualizations are considerable via this ever growing software package replete with a vast community of users providing support and ideas. A web site with supplemental data and resources will be made available at: http://www.cv.nrao.edu/~bkent/blender/.
Bitte wählen Sie Ihr Anliegen aus.
Rechnungen
Retourenschein anfordern
Bestellstatus
Storno

