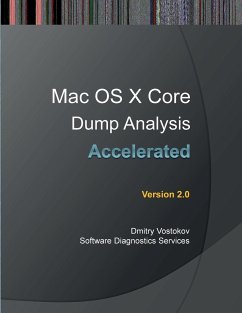
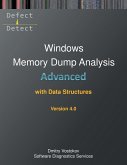
The full transcript of Software Diagnostics Services (former Memory Dump Analysis Services) training with 12 step-by-step exercises. Learn how to analyse app crashes and freezes, navigate through process core memory dump space and diagnose corruption, memory leaks, CPU spikes, blocked threads, deadlocks, wait chains, and much more. We use a unique and innovative pattern-driven analysis approach to speed up the learning curve. The training consists of practical step-by-step exercises using GDB and LLDB debuggers highlighting more than 30 memory analysis patterns diagnosed in 64-bit process core memory dumps. The training also includes source code of modelling applications written in Xcode environment, a catalogue of relevant patterns from Software Diagnostics Institute, and an overview of relevant similarities and differences between Windows and Mac OS X user space memory dump analysis useful for engineers with Wintel background. Audience: Software technical support and escalation engineers, system administrators, software developers, security professionals and quality assurance engineers.
Hinweis: Dieser Artikel kann nur an eine deutsche Lieferadresse ausgeliefert werden.
Hinweis: Dieser Artikel kann nur an eine deutsche Lieferadresse ausgeliefert werden.

