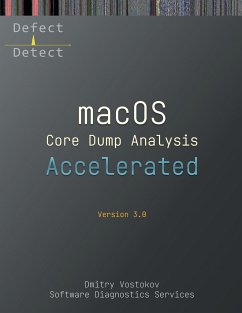
The full transcript of Software Diagnostics Services training with 12 step-by-step exercises. Learn how to analyze app crashes and freezes, navigate through process core memory dump space and diagnose corruption, memory leaks, CPU spikes, blocked threads, deadlocks, wait chains, and much more. We use a unique and innovative pattern-driven analysis approach to speed up the learning curve. The training consists of practical step-by-step exercises using Xcode and LLDB environments, highlighting more than 30 analysis patterns from Software Diagnostics Institute diagnosed in ARM64 process core memory dumps. The training also includes an overview of relevant similarities and differences between Windows and macOS user space memory dump analysis useful for engineers with a Wintel background and the relevant ARM64 disassembly tutorial. The course is thoroughly updated for the latest macOS version and M2 platform. The primary audience for this training is software technical support and escalation engineers who analyze crash reports and memory dumps, quality assurance and software engineers who test and debug macOS software, security and vulnerability researchers, and malware and memory forensics analysts who have never used LLDB for the analysis of computer memory.
Bitte wählen Sie Ihr Anliegen aus.
Rechnungen
Retourenschein anfordern
Bestellstatus
Storno

