Mike Potter
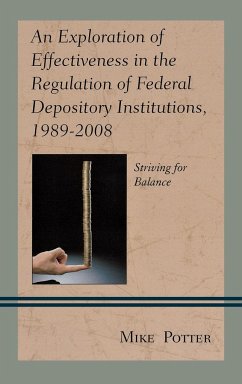
An Exploration of Effectiveness in the Regulation of Federal Depository Institutions, 1989-2008
Striving for Balance
Mike Potter
An Exploration of Effectiveness in the Regulation of Federal Depository Institutions, 1989-2008
Striving for Balance
- Gebundenes Buch
- Merkliste
- Auf die Merkliste
- Bewerten Bewerten
- Teilen
- Produkt teilen
- Produkterinnerung
- Produkterinnerung
This book is an applied study of regulatory policymaking. It investigates the qualities that make regulators effective and concludes that effective regulators balance a public interest orientation with openness towards their regulated communities.
Andere Kunden interessierten sich auch für
![Measuring the Effectiveness of Real Estate Regulation Measuring the Effectiveness of Real Estate Regulation]() Measuring the Effectiveness of Real Estate Regulation97,99 €
Measuring the Effectiveness of Real Estate Regulation97,99 €![Regional Institutions, Geopolitics and Economics in the Asia-Pacific Regional Institutions, Geopolitics and Economics in the Asia-Pacific]() Regional Institutions, Geopolitics and Economics in the Asia-Pacific229,99 €
Regional Institutions, Geopolitics and Economics in the Asia-Pacific229,99 €![Factors that Impact the Effectiveness of Poverty Alleviation Program Factors that Impact the Effectiveness of Poverty Alleviation Program]() Roseline Jindori Yunusa VakkaiFactors that Impact the Effectiveness of Poverty Alleviation Program26,99 €
Roseline Jindori Yunusa VakkaiFactors that Impact the Effectiveness of Poverty Alleviation Program26,99 €![Globalization, Institutions, and Regional Development in Europe Globalization, Institutions, and Regional Development in Europe]() Omnia AminGlobalization, Institutions, and Regional Development in Europe91,99 €
Omnia AminGlobalization, Institutions, and Regional Development in Europe91,99 €![Institutions, Partisanship and Credibility in Global Financial Markets Institutions, Partisanship and Credibility in Global Financial Markets]() Hye Jee ChoInstitutions, Partisanship and Credibility in Global Financial Markets66,99 €
Hye Jee ChoInstitutions, Partisanship and Credibility in Global Financial Markets66,99 €![The Effectiveness of Social Safety Net Programmes The Effectiveness of Social Safety Net Programmes]() Diyala AbdlrasulThe Effectiveness of Social Safety Net Programmes28,99 €
Diyala AbdlrasulThe Effectiveness of Social Safety Net Programmes28,99 €![Ombuds Institutions, Good Governance and the International Human Rights System Ombuds Institutions, Good Governance and the International Human Rights System]() Linda C ReifOmbuds Institutions, Good Governance and the International Human Rights System189,99 €
Linda C ReifOmbuds Institutions, Good Governance and the International Human Rights System189,99 €-
-
-
This book is an applied study of regulatory policymaking. It investigates the qualities that make regulators effective and concludes that effective regulators balance a public interest orientation with openness towards their regulated communities.
Hinweis: Dieser Artikel kann nur an eine deutsche Lieferadresse ausgeliefert werden.
Hinweis: Dieser Artikel kann nur an eine deutsche Lieferadresse ausgeliefert werden.
Produktdetails
- Produktdetails
- Verlag: Lexington Books
- Seitenzahl: 144
- Erscheinungstermin: 19. September 2013
- Englisch
- Abmessung: 235mm x 157mm x 13mm
- Gewicht: 370g
- ISBN-13: 9780739179352
- ISBN-10: 0739179357
- Artikelnr.: 38535101
- Herstellerkennzeichnung
- Libri GmbH
- Europaallee 1
- 36244 Bad Hersfeld
- gpsr@libri.de
Mike Potter is assistant professor at Appalachian State University. He worked for the West Virginia State Legislature and the American Bankers Association. He holds a Ph.D. in Public Administration and Public Affairs from the Center for Public Administration and Policy at Virginia Tech. He has published articles in Administration & Society. His research interests include ethics and financial services policy.
Chapter 1: Introduction Statement of the Problem Figure 1.1: Total Assets
Under Supervision, 1998 through 2008 Figure 1.2: Mentions in the
Congressional Committee Reports by Agency, 1995 through 2008 Research
Question Regulatory Effectiveness Figure 1.3: Failure Rates Expressed as
Percentage of Regulated Institutions by Agency, 1998 through 2008
Understanding Bank Failure: The Case of Superior Bank Agency Relationships
with their Regulated Communities Figure 1.4 Ideal Regulatory Agency
Policymaking Understanding Self-funding and Charter Competition Overview of
Study Chapter 2: The Challenge of Distilling and Examining a Theory of
Regulatory Effectiveness Table 2.1: Selected Scholarship on Regulatory
Effectiveness Working Model of Regulatory Effectiveness Figure 2.1: Working
Model of Regulatory Effectiveness Regulatory Effectiveness Propositions
Study Design Table 2.2: Agency Comparison The Agencies National Credit
Union Administration Office of Thrift Supervision Office of the Comptroller
of the Currency Other Regulators Operationalizations, Data, and Data
Analysis Table 2.3: Empirical Examination: Concepts, Variables, and Data
Sources Chapter 3: The Impact of Agency Longevity on Financial Services
Regulatory Effectiveness Table 3.1: Relationships Between Longevity and
Financial Resources by Agency Overview of the Statistical Models Agency
Longevity and Failures Table 3.2: Impact of Agency Age on Failures of
Regulated Institutions Conclusion Chapter 4: The Impact of Ability to
Manage Political Complexity, Front-line Employees, and Political Appointee
Turnover on Regulatory Effectiveness Congressional Attention and Front-line
Staff Table 4.1: Impact of Congressional Attention and Percentage of
Examiners on the Failures of Regulatory Institutions Congressional
Attention Figure 4.1: Congressional Testimony by Agency, 1999 through 2008
Table 4.2: Relationships Between Congressional Attention and Effectiveness
Front-line Staff Figure 4.2: Percentages of Examiners by Agency, 1998
through 2008 Table 4.3: Ratios of Examiners per Regulated Institutions by
Agency, 1998 to 2008 A Narrative Analysis of Political Appointee Turnover
Table 4.4: NCUA Political Appointees, 1989 through 2008 Table 4.5: OTS
Political Appointees, 1989 through 2008 Table 4.6: OCC Political
Appointees, 1989 through 2008 Figure 4.3: Number of Changes in Political
Appointees by Agency, 1989 through 2008 Table 4.7: Relationships between
Political Turnover and Effectiveness by Agency Conclusion Chapter 5: Impact
of Mission Stability, Regulatory Style, and Financial Resources on
Regulatory Effectiveness Mission Stability NCUA OTS Figure 5.1: Mentions in
the Congressional Record by Agency, 1989 through 2008 OCC Figure 5.2:
Number of Changes in Mission by Agency, 1989 through 2008 Table 5.1:
Mission Changes and Regulatory Effectiveness Regulatory Style Non-legal
Interventions Legal Interventions Figure 5.3: Annual Legal Intervention
Percentage by Agency, 1998 through 2008 Figure 5.4: Enforcement Rates as
Percentages of Regulated Institutions by Agency, 1998 through 2008
Resources Figure 5.5: Budgets by Agency, 1995 through 2008 (in $2011)
Figure 5.6: OCC, OTS, and NCUA Budget per Institution Regulated (in $2011)
Table 5.2: Relationships Between Resources and Effectiveness Table 5.3:
Impact of Mission Stability, Regulatory Style and Resources on Regulated
Institutions General Discussion of Findings Conclusion Chapter 6:
Conclusions Summary of Key Findings Figure 6.1 Revised Working Model of
Regulatory Effectiveness Normative Reflections Figure 6.2: Regulatory
Agency Policymaking Future Research Conclusions References


