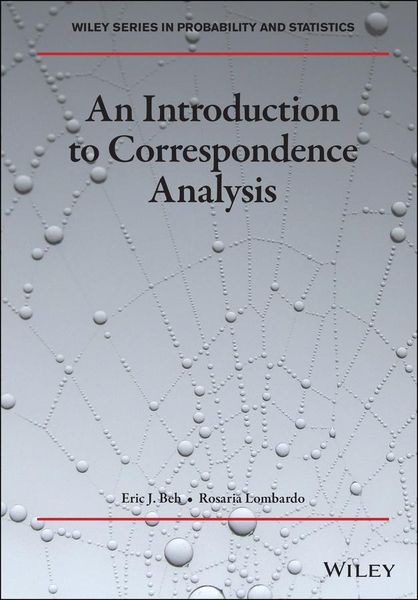
Intro Correspondence Analysis
77,99 €
inkl. gesetzl. MwSt.,
Beschreibung
Produktdetails
Einband
Gebundene Ausgabe
Erscheinungsdatum
01.01.1900
Verlag
John Wiley & Sons IncSeitenzahl
240
Maße (L/B/H)
24,4/17/1,4 cm
Gewicht
576 g
Auflage
1. Auflage
Sprache
Englisch
ISBN
978-1-119-04194-8
An Introduction to Correspondence Analysis assists researchers in improving their familiarity with the concepts, terminology, and application of several variants of correspondence analysis. The accomplished academics and authors deliver a comprehensive and insightful treatment of the fundamentals of correspondence analysis, including the statistical and visual aspects of the subject.
Written in three parts, the book begins by offering readers a description of two variants of correspondence analysis that can be applied to two-way contingency tables for nominal categories of variables. Part Two shifts the discussion to categories of ordinal variables and demonstrates how the ordered structure of these variables can be incorporated into a correspondence analysis. Part Three describes the analysis of multiple nominal categorical variables, including both multiple correspondence analysis and multi-way correspondence analysis.
Readers will benefit from explanations of a wide variety of specific topics, for example:
* Simple correspondence analysis, including how to reduce multidimensional space, measuring symmetric associations with the Pearson Ratio, constructing low-dimensional displays, and detecting statistically significant points
* Non-symmetrical correspondence analysis, including quantifying asymmetric associations
* Simple ordinal correspondence analysis, including how to decompose the Pearson Residual for ordinal variables
* Multiple correspondence analysis, including crisp coding and the indicator matrix, the Burt Matrix, and stacking
* Multi-way correspondence analysis, including symmetric multi-way analysis
Perfect for researchers who seek to improve their understanding of key concepts in the graphical analysis of categorical data, An Introduction to Correspondence Analysis will also assist readers already familiar with correspondence analysis who wish to review the theoretical and foundational underpinnings of crucial concepts.
Noch keine Bewertungen vorhanden
Verfassen Sie die erste Bewertung zu diesem Artikel
Helfen Sie anderen Kundinnen und Kunden durch Ihre Meinung.
Kurze Frage zu unserer Seite
Vielen Dank für dein Feedback
Wir nutzen dein Feedback, um unsere Produktseiten zu verbessern. Bitte habe Verständnis, dass wir dir keine Rückmeldung geben können. Falls du Kontakt mit uns aufnehmen möchtest, kannst du dich aber gerne an unseren Kund*innenservice wenden.
zum Kundenservice