Micheal Longnecker (Texas A & M University), R. Ott
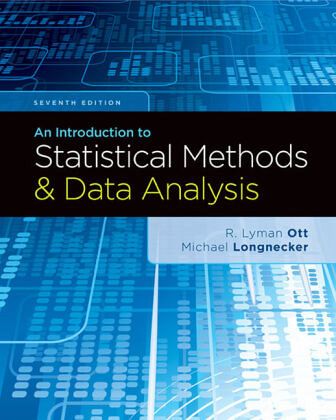
An Introduction to Statistical Methods and Data Analysis
Micheal Longnecker (Texas A & M University), R. Ott
An Introduction to Statistical Methods and Data Analysis
- Broschiertes Buch
- Merkliste
- Auf die Merkliste
- Bewerten Bewerten
- Teilen
- Produkt teilen
- Produkterinnerung
- Produkterinnerung
Ott and Longnecker's AN INTRODUCTION TO STATISTICAL METHODS AND DATA ANALYSIS, Seventh Edition, provides a broad overview of statistical methods for advanced undergraduate and graduate students from a variety of disciplines who have little or no prior course work in statistics. The authors teach students to solve problems encountered in research projects, to make decisions based on data in general settings both within and beyond the university setting, and to become critical readers of statistical analyses in research papers and news reports. The first eleven chapters present material…mehr
Andere Kunden interessierten sich auch für
- Oliver SchabenbergerStatistical Methods for Spatial Data Analysis40,99 €
- Roxy Peck (San Luis Obispo California Polytechnic State UniversityIntroduction to Statistics and Data Analysis295,99 €
- Melinda C. Mills (University of Oxford Professor)An Introduction to Statistical Genetic Data Analysis45,99 €
- Jeremy KilpatrickThe Statistical Analysis of Experimental Data20,99 €
- William Q. Meeker (Ames Iowa State University)Statistical Methods for Reliability Data165,99 €
- Scott PardoStatistical Methods for Field and Laboratory Studies in Behavioral Ecology75,99 €
- Jeffrey Paul WheelerAn Introduction to Optimization with Applications in Machine Learning and Data Analytics77,99 €
-
-
-
Ott and Longnecker's AN INTRODUCTION TO STATISTICAL METHODS AND DATA ANALYSIS, Seventh Edition, provides a broad overview of statistical methods for advanced undergraduate and graduate students from a variety of disciplines who have little or no prior course work in statistics. The authors teach students to solve problems encountered in research projects, to make decisions based on data in general settings both within and beyond the university setting, and to become critical readers of statistical analyses in research papers and news reports. The first eleven chapters present material typically covered in an introductory statistics course, as well as case studies and examples that are often encountered in undergraduate capstone courses. The remaining chapters cover regression modeling and design of experiments.
Hinweis: Dieser Artikel kann nur an eine deutsche Lieferadresse ausgeliefert werden.
Produktdetails
- Produktdetails
- Verlag: Brooks Cole / Cengage Learning EMEA
- 7. Aufl.
- Seitenzahl: 1296
- Erscheinungstermin: 3. September 2021
- Englisch
- Abmessung: 251mm x 203mm x 43mm
- Gewicht: 2131g
- ISBN-13: 9780357670620
- ISBN-10: 0357670620
- Artikelnr.: 59987224
- Herstellerkennzeichnung
- Produktsicherheitsverantwortliche/r
- Europaallee 1
- 36244 Bad Hersfeld
- gpsr@libri.de
Lyman Ott earned his Bachelor's degree in Mathematics and Education and Master's degree in Mathematics from Bucknell University, and Ph.D in Statistics from the Virginia Polytechnic Institute. After two years working in statistics in the pharmaceutical industry, Dr. Ott became assistant professor in the Statistic Department at the University of Florida in 1968 and was named associate professor in 1972. He joined Merrell-National laboratories in 1975 as head of the Biostatistics Department and then head of the company's Research Data Center. He later became director of Biomedical Information Systems, Vice President of Global Systems and Quality Improvement in Research and Development, and Senior Vice President Business Process Improvement and Biometrics. He retired from the pharmaceutical industry in 1998, and now serves as consultant and Board of Advisors member for Abundance Technologies, Inc. Dr. Ott has published extensively in scientific journals and authored or co-authored seven college textbooks including Basic Statistical Ideas for Managers, Statistics: A Tool for the Social Sciences and An Introduction to Statistical Methods and Data Analysis. He has been a member of the Industrial Research Institute, the Drug Information Association and the Biometrics Society. In addition, he is a Fellow of the American Statistical Association and received the Biostatistics Career Achievement Award from the Pharmaceutical research and Manufacturers of America in 1998. He was also an All-American soccer player in college and is a member of the Bucknell University Athletic Hall of Fame.
PART 1: INTRODUCTION.1. Statistics and the Scientific Method.Introduction. Why Study Statistics? Some Current Applications of Statistics. A Note to the Student. Summary. Exercises.PART 2: COLLECTING DATA.2. Using Surveys and Scientific Studies to Collect Data.Introduction and Abstract of Research Study. Observational Studies. Sampling Designs for Surveys. Experimental Studies. Designs for Experimental Studies. Research Study: Exit Polls versus Election Results. Summary. Exercises.PART 3: SUMMARIZING DATA.3. Data Description.Introduction and Abstract of Research Study. Calculators, Computers, and Software Systems. Describing Data on a Single Variable: Graphical Methods. Describing Data on a Single Variable: Measures of Central Tendency. Describing Data on a Single Variable: Measures of Variability. The Boxplot. Summarizing Data from More Than One Variable: Graphs and Correlation. Research Study: Controlling for Student Background in the Assessment of Teaching. Summary and Key Formulas. Exercises.4. Probability And Probability Distributions.Introduction and Abstract of Research Study. Finding the Probability of an Event. Basic Event Relations and Probability Laws. Conditional Probability and Independence. Bayes' Formula. Variables: Discrete and Continuous. Probability Distributions for Discrete Random Variables. Two Discrete Random Variables: The Binomial and the Poisson. Probability Distributions for Continuous Random Variables. A Continuous Probability Distribution: The Normal Distribution. Random Sampling. Sampling Distributions. Normal Approximation to the Binomial. Evaluating Whether or Not a Population Distribution Is Normal. Research Study: Inferences about Performance Enhancing Drugs among Athletes. Minitab Instructions. Summary and Key Formulas. Exercises.PART 4: ANALYZING DATA, INTERPRETING THE ANALYSES, AND COMMUNICATING RESULTS.5. Inferences about Population Central Values.Introduction and Abstract of a Research Study. Estimation of µ. Choosing the Sample Size for Estimating µ. A Statistical Test for µ. Choosing the Sample Size for µ. The Level of Significance of a Statistical Test. Inferences about µ for a Normal Population, s Unknown. Inferences about µ when Population in Nonnormal and n is small: Bootstrap Methods. Inferences about the Median. Research Study: Percent Calories from Fat. Summary and Key Formulas. Exercises.6. Inferences Comparing Two Population Central Values.Introduction and Abstract of a Research Study. Inferences about µ1 - µ2: Independent Samples. A Nonparametric Alternative: The Wilcoxon Rank Sum Test. Inferences about µ1 - µ2: Paired Data. A Nonparametric Alternative: The Wilcoxon Signed-Rank Test. Choosing Sample Sizes for Inferences about µ1 - µ2. Research Study: Effects of Oil Spill on Plant Growth. Summary. Exercises.7. Inferences about Population Variances.Introduction and Abstract of a Research Study. Estimation and Tests for a Population Variance. Estimation and Tests for Comparing Two Population Variances. Tests for Comparing t > 2 Population Variances. Research Study: Evaluation of Methods for Detecting E. coli. Summary and Key Formulas. Exercises.8. Inferences About More Than Two Population Central ValuesIntroduction and Abstract of a Research Study. A Statistical Test About More Than Two Population Means: An Analysis of Variance. The Model for Observations in a Completely Randomized Design. Checking on the AOV Conditions. An Alternative Analysis: Transformations of the Data. A Nonparametric Alternative: The Kruskal-Wallis Test. Research Study: Effect on Timing on the Treatment of Port-Wine Stains with Lasers. Summary and Key Formulas. Exercises.9. Multiple Comparisons.Introduction and Abstract of Research Study. Linear Contrasts. Which Error Rate Is Controlled? Fisher's Least Significant Difference. Tukey's W Procedure. Student-Neuman-Keuls Procedure. Dunnett's Procedure: Comparison of Treatments to a Control. Scheffé's S Method. A Nonparametric Multiple-Compari