49,99 €
inkl. MwSt.
Versandkostenfrei*
Versandfertig in 2-4 Wochen
  • Gebundenes Buch

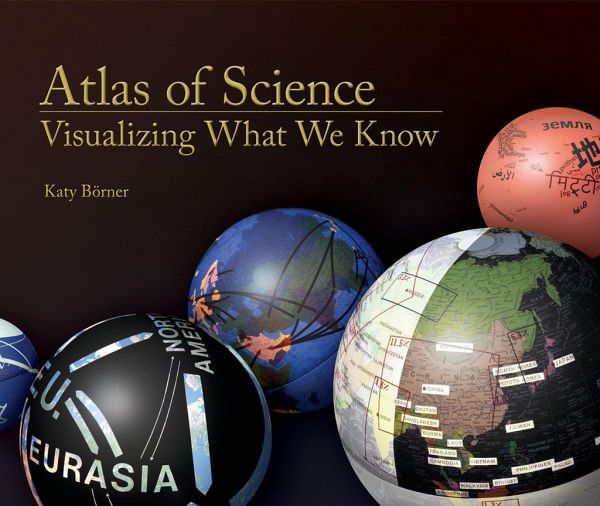
"Presents more than thirty full-page science maps, fifty data charts, a timeline of science-mapping milestones, and 500 color images, which serve as a sumptuous visual index to the evolution of modern science and as an introduction to 'the science of science'--charting the trajectory from scientific concept to published results."--

Produktbeschreibung
"Presents more than thirty full-page science maps, fifty data charts, a timeline of science-mapping milestones, and 500 color images, which serve as a sumptuous visual index to the evolution of modern science and as an introduction to 'the science of science'--charting the trajectory from scientific concept to published results."--
Hinweis: Dieser Artikel kann nur an eine deutsche Lieferadresse ausgeliefert werden.
Autorenporträt
Katy Börner
Rezensionen
...I am enthusiastic about this exhibition. For anyone interested in visualization, maps or science, it is a veritable cornucopia and the author is to be congratulated for the imagination and energy she has put into the project. Professor Tom Wilson, Editor-in-Chief, Information Research
This book and its complementary online exhibit are recommended as an educational source for getting a broader understanding of scientific visualization...This book is recommended for high school, academic, and large public libraries and it should be on the shelves of those interested in the connection between the graphic arts and the sciences. Nestor L. Osorio, Issues in Science and Technology Librarianship
This book has a wide potential audience, including laypersons interested in science, undergraduates, graduate students, and practitioners. It should also adorn coffee tables in science departments around the world. R.A. Kolvoord, James Madison University, CHOICE