- Broschiertes Buch
- Merkliste
- Auf die Merkliste
- Bewerten Bewerten
- Teilen
- Produkt teilen
- Produkterinnerung
- Produkterinnerung
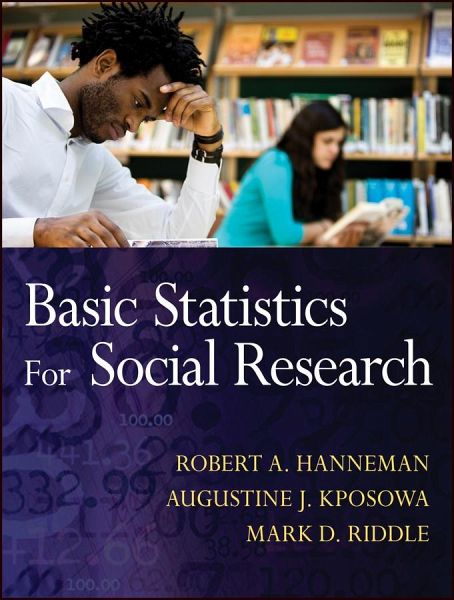
Basic Statistics for Social Research offers an introduction to core general statistical concepts and methods. It covers procedural aspects of the application of statistical methods for data-description ; and hypothesis-testing ; distributions, tabulations, central tendency, variability, independence, correlation and regression. The use of math and theory are deliberately limited, and the authors focus on how the concepts and tools of statistics are used in the analysis of social science data, rather than on the mathematical and computational aspects. The book also emphasizes the use of…mehr
Andere Kunden interessierten sich auch für
- Don A. DillmanInternet, Phone, Mail, and Mixed-Mode Surveys97,99 €
- Brenda RussellOnline Research Essentials70,99 €
- William E. MartinQuantitative and Statistical Research Methods105,99 €
- Sue C. FunnellPurposeful Program Theory102,99 €
- Daniel L. StufflebeamEvaluation Theory, Models, and Applications103,99 €
- Qualitative Inquiry in Evaluation93,99 €
- Stephen IngleSocialist Thought in Imaginative Literature63,99 €
-
-
-
Basic Statistics for Social Research offers an introduction to core general statistical concepts and methods. It covers procedural aspects of the application of statistical methods for data-description ; and hypothesis-testing ; distributions, tabulations, central tendency, variability, independence, correlation and regression. The use of math and theory are deliberately limited, and the authors focus on how the concepts and tools of statistics are used in the analysis of social science data, rather than on the mathematical and computational aspects. The book also emphasizes the use of computer software to calculate statistics. The book is designed for students in the social sciences.
Hinweis: Dieser Artikel kann nur an eine deutsche Lieferadresse ausgeliefert werden.
Produktdetails
- Produktdetails
- Research Methods for the Social Sciences .
- Verlag: Wiley & Sons
- 1. Auflage
- Seitenzahl: 560
- Erscheinungstermin: 4. Dezember 2012
- Englisch
- Abmessung: 234mm x 178mm x 33mm
- Gewicht: 885g
- ISBN-13: 9780470587980
- ISBN-10: 0470587989
- Artikelnr.: 36026594
- Herstellerkennzeichnung
- Produktsicherheitsverantwortliche/r
- Europaallee 1
- 36244 Bad Hersfeld
- gpsr@libri.de
ROBERT A. HANNEMAN is a professor of sociology at the University of California, Riverside. AUGUSTINE J. KPOSOWA is a professor of sociology at the University of California, Riverside. MARK D. RIDDLE is the Director of Institutional Research at Antioch University Los Angeles.
Tables and Figures ix
Preface xv
About the Authors xix
Part I Univariate Description 1
Chapter 1 Using Statistics 3
Why Study Statistics? 4
Tasks for Statistics: Describing, Inferring, Testing, Predicting 4
Statistics in the Research Process 9
Basic Elements of Research: Units of Analysis and Variables 14
Chapter 2 Displaying One Distribution 25
Summarizing Variation in One Variable 26
Frequency Distributions for Nominal Variables 26
Frequency Distributions for Ordinal Variables 32
Frequency Distributions for Interval/Ratio Variables 38
Summarizing Data Using Excel 43
Chapter 3 Central Tendency 81
The Basic Idea of Central Tendency 82
The Mode 83
The Median 88
The Mean 95
Chapter 4 Dispersion 113
The Basic Idea of Dispersion 114
Dispersion of Categorical Data 115
Dispersion of Interval/Ratio Data 121
Chapter 5 Describing the Shape of a Distribution 149
The Basic Ideas of Distributional Shape 150
The Shape of Nominal and Ordinal Distributions 152
Unimodality 158
Skewness 163
Kurtosis 169
Some Common Distributional Shapes 175
Chapter 6 The Normal Distribution 187
Introduction to the Normal Distribution 188
Properties of Normal Distributions 189
The Standard Normal, or Z, Distribution 192
Working with Standard Normal (Z) Scores 194
Finding Areas "Under the Curve" 197
Part II Inference and Hypothesis Testing 209
Chapter 7 Basic Ideas of Statistical Inference 211
Introduction to Statistical Inference 212
Sampling Concepts 214
Central Tendency Estimates 219
Assessing Confidence in Point Estimates 229
Chapter 8 Hypothesis Testing for One Sample 247
Hypothesis Testing 248
The Testing Process 250
Tests about One Mean 258
Tests about One Proportion 267
Chapter 9 Hypothesis Testing for Two Samples 279
Comparing Two Groups 280
Comparing Two Groups' Means 280
Comparing Two Groups' Proportions 289
Non independent Samples 296
Using Excel for Two-Sample Tests 301
Interpreting Group Differences 302
Chapter 10 Multiple Sample Tests of Proportions: Chi-Squared 313
Comparing Proportions across Several Groups 314
Testing for Multiple Group Differences 315
Describing Group Differences 327
Chapter 11 Multiple Sample Tests for Means: One-Way ANOVA 337
Comparing Several Group Means with Analysis of Variance 338
Analyzing Variance and the F-Test 339
Analyzing Variance 342
The F-Test 350
Comparing Means 356
Part III Association and Prediction 369
Chapter 12 Association with Categorical Variables 371
The Concept of Statistical Association 372
Association with Nominal Variables 375
Association with Ordinal Variables 391
Chapter 13 Association of Interval/Ratio Variables 425
Visualizing Interval/Ratio Association 426
Significance Testing for Interval/Ratio Association 434
Chapter 14 Regression Analysis 453
Predicting Outcomes with Regression 454
Simple Linear Regression 454
Applying Simple Regression Analysis 465
Multiple Regression 469
Applying Multiple Regression 474
Chapter 15 Logistic Regression Analysis 489
Predicting with Nonlinear Relationships 490
Logistic Regression 492
The Logistic Regression Model 492
Interpreting Effects in Logistic Regression 493
Estimating Logistic Regression Models with Maximum Likelihood 495
Applying Logistic Regression 496
Assessing Partial Effects 498
Extending Logistic Regression 499
Appendix
Chi-Squared Distribution: Critical Values for Commonly Used Alpha=0.05 and
Alpha=0.01 505
F-Distribution: Critical Values for Commonly Used Alpha=0.05 and Alpha=0.01
507
Standard Normal Scores (Z-Scores), and Cumulative Probabilities (Proportion
of Cases Having Scores below Z) 511
Student's t-Distribution: Critical Values for Commonly Used Alpha Levels
517
Index 519