- Broschiertes Buch
- Merkliste
- Auf die Merkliste
- Bewerten Bewerten
- Teilen
- Produkt teilen
- Produkterinnerung
- Produkterinnerung
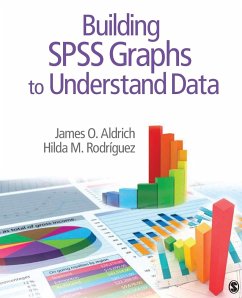
This handy guide can be used in conjunction with any introductory or intermediate statistics book where the focus is on in-depth presentation of how graphs are used.
Andere Kunden interessierten sich auch für
![Data Visualization in Excel Data Visualization in Excel]() Jonathan SchwabishData Visualization in Excel26,99 €
Jonathan SchwabishData Visualization in Excel26,99 €![Data Analytics on Graphs Data Analytics on Graphs]() Ljubisa StankovicData Analytics on Graphs185,99 €
Ljubisa StankovicData Analytics on Graphs185,99 €![An EasyGuide to Research Design & SPSS An EasyGuide to Research Design & SPSS]() Beth M. SchwartzAn EasyGuide to Research Design & SPSS83,99 €
Beth M. SchwartzAn EasyGuide to Research Design & SPSS83,99 €![Moving from Ibm(r) Spss(r) to R and Rstudio(r) Moving from Ibm(r) Spss(r) to R and Rstudio(r)]() Howard T. TokunagaMoving from Ibm(r) Spss(r) to R and Rstudio(r)48,99 €
Howard T. TokunagaMoving from Ibm(r) Spss(r) to R and Rstudio(r)48,99 €![Record, Map and Capture in Textile Art Record, Map and Capture in Textile Art]() Jordan CunliffeRecord, Map and Capture in Textile Art20,38 €
Jordan CunliffeRecord, Map and Capture in Textile Art20,38 €![R in Action R in Action]() Robert KabacoffR in Action38,99 €
Robert KabacoffR in Action38,99 €![Building Knowledge Graphs Building Knowledge Graphs]() Jesus BarrasaBuilding Knowledge Graphs79,99 €
Jesus BarrasaBuilding Knowledge Graphs79,99 €-
-
-
This handy guide can be used in conjunction with any introductory or intermediate statistics book where the focus is on in-depth presentation of how graphs are used.
Produktdetails
- Produktdetails
- Verlag: SAGE Publications Inc
- Artikelnr. des Verlages: B16843P
- Seitenzahl: 394
- Erscheinungstermin: 19. April 2012
- Englisch
- Abmessung: 235mm x 191mm x 21mm
- Gewicht: 646g
- ISBN-13: 9781452216843
- ISBN-10: 1452216843
- Artikelnr.: 35086206
- Herstellerkennzeichnung
- Libri GmbH
- Europaallee 1
- 36244 Bad Hersfeld
- gpsr@libri.de
James O. Aldrich (Doctor of Public Administration, University of Laverne) is a retired lecturer on statistics and research methods at California State University, Northridge. He has also taught graduate level research courses for the University of La Verne. Dr. Aldrich held the appointment of Instructor in the Department of Pathology at the University of Southern California, School of Medicine where he served as the Principal Investigator and codirector of a National Cancer Institute research project. He has served on various committees for the Los Angeles chapter of the American Statistical Association and has also taught biostatistics, epidemiology, social statistics, and research methods courses for 20 years. The primary computer program used for his coursework has been the IBM SPSS Statistics software package. SAGE recently published, in 2013, Building SPSS Graphs to Understand Data, coauthored with Hilda M. Rodriguez.
Chapter 1. Introduction: Graphical Presentation of Data
Chapter 2. Simple Bar Graph
Chapter 3. Stacked Bar Graph
Chapter 4. Clustered Bar Graph
Chapter 5. Pie Graph
Chapter 6. Simple Line Graph
Chapter 7. Multiple Line Graph
Chapter 8. Simple Histogram
Chapter 9. Population Pyramid
Chapter 10. 1-D Boxplot
Chapter 11. Simple Boxplot
Chapter 12. Clustered Boxplot
Chapter 13. Simple Scatterplot
Chapter 14. Grouped Scatterplot
Chapter 15. High-Low Graphs
Chapter 16. Paneling on One Dimension
Chapter 17. Paneling on Two Dimensions
Chapter 18. Deceptive Graphing Examples
Chapter 19. Summary
Appendix A. SPSS Basic Information
Appendix B. Answers to Chapter Exercises
Appendix C. Chapters and SPSS Databases Used
Appendix D. Graph Selection - Type and Purpose


