Haibin Xie (University of International Business and Chi Economics, Kuikui Fan (Univ of Economics and China Business), Shouyang Wang (China Chinese Academy of Sciences)
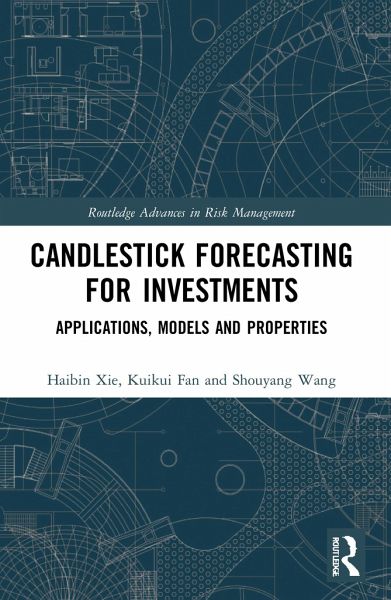
Candlestick Forecasting for Investments
Applications, Models and Properties
Haibin Xie (University of International Business and Chi Economics, Kuikui Fan (Univ of Economics and China Business), Shouyang Wang (China Chinese Academy of Sciences)
Candlestick Forecasting for Investments
Applications, Models and Properties
- Broschiertes Buch
- Merkliste
- Auf die Merkliste
- Bewerten Bewerten
- Teilen
- Produkt teilen
- Produkterinnerung
- Produkterinnerung
Candlestick charts are often used in speculative markets to describe and forecast asset price movements. This book is the first of its kind to investigate candlestick charts and their statistical properties.
Andere Kunden interessierten sich auch für
- Lawrence G. McMillanOptions as a Strategic Investment39,99 €
- Mark DouglasTrading in the Zone57,99 €
- Jerome Yen (Macau University of Macau)Emerging Financial Derivatives60,99 €
- Kate KellyThe Secret Club That Runs the World14,99 €
- Dan ArielyPredictably Irrational14,99 €
- Danielle TownInvested13,99 €
- Carol LoomisTap Dancing to Work11,99 €
-
-
-
Candlestick charts are often used in speculative markets to describe and forecast asset price movements. This book is the first of its kind to investigate candlestick charts and their statistical properties.
Hinweis: Dieser Artikel kann nur an eine deutsche Lieferadresse ausgeliefert werden.
Produktdetails
- Produktdetails
- Routledge Advances in Risk Management
- Verlag: Taylor & Francis Ltd
- Seitenzahl: 134
- Erscheinungstermin: 26. September 2022
- Englisch
- Abmessung: 234mm x 156mm x 8mm
- Gewicht: 218g
- ISBN-13: 9780367703394
- ISBN-10: 0367703394
- Artikelnr.: 65614270
- Herstellerkennzeichnung
- Books on Demand GmbH
- In de Tarpen 42
- 22848 Norderstedt
- info@bod.de
- 040 53433511
Haibin Xie is Associate Professor at the School of Banking and Finance, University of International Business and Economics. Kuikui Fan is affiliated with the School of Statistics, Capital University of Economics and Business. Shouyang Wang is Professor at the Academy of Mathematics and Systems Science, Chinese Academy of Sciences.
PART I INTRODUCTION AND OUTLINE 1. Introduction 1.1 Technical analysis
before the 1970s 1.2 Technical analysis during 1990s-2000s 1.3 Recent
advances in technical analysis 1.4 Summary 2. Outline of this book PART II
CANDLESTICK 3. Basic concepts 4. Statistical properties 4.1 Propositions
4.2 Simulations 4.3 Empirical evidence 4.4 Summary PART III STATISTICAL
MODELS 5. DVAR model 5.1 The model 5.2 Statistical foundation 5.3
Simulations 5.4 Empirical results 5.5 Summary 6. Shadows in DVAR 6.1
Simulations 6.2 Theoretical explanation 6.3 Empirical evidence 6.4 Summary
PART IV APPLICATIONS 7. Market volatility timing 7.1 Introduction 7.2
GARCH@CARR model 7.3 Economic value of volatility timing 7.4 Empirical
results 7.5 Summary 8. Technical range forecasting 8.1 Introduction 8.2
Econometric methods 8.3 An empirical study 8.4 Summary 9. Technical range
spillover 9.1 Introduction 9.2 Econometric method 9.3 An empirical study:
DAX and CAC40 9.4 Summary 10. Stock return forecasting: U.S. S&P500 10.1
Introduction 10.2 Econometric methods 10.3 Statistical evidence 10.4
Economic evidence 10.5 More details 10.6 Summary 11. Oil price forecasting:
WTI Crude Oil 11.1 Introduction 11.2 Econometric method 11.3 Empirical
results 11.4 Summary PART V CONCLUSIONS AND FUTURE STUDIES 12. Main
conclusions 13. Future studies