John C. Reinard
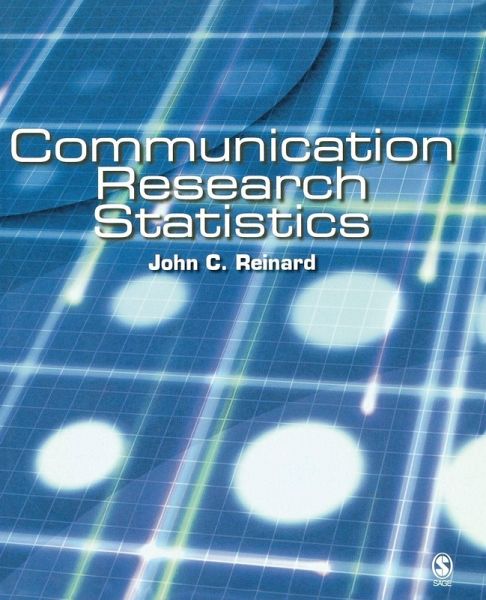
Communication Research Statistics
John C. Reinard
Communication Research Statistics
- Broschiertes Buch
- Merkliste
- Auf die Merkliste
- Bewerten Bewerten
- Teilen
- Produkt teilen
- Produkterinnerung
- Produkterinnerung
While most books on statistics seem to be written as though targeting other statistics professors, John Reinard's Communication Research Statistics is especially impressive because it is clearly intended for the student reader, filled with unusually clear explanations and with illustrations on the use of SPSS. I enjoyed reading this lucid, student-friendly book and expect students will benefit enormously from its content and presentation. Well done!" --John C. Pollock, The College of New Jersey Written in an accessible style using straightforward and direct language, Communication Research…mehr
Andere Kunden interessierten sich auch für
- Duncan CramerThe Sage Dictionary of Statistics199,99 €
- Neil BurdessStarting Statistics180,99 €
- Richard StartupIntroducing Social Statistics159,99 €
- Eelko K R E HuizinghApplied Statistics with SPSS240,99 €
- Liam FosterBeginning Statistics233,99 €
- Geoff CummingIntroduction to the New Statistics244,99 €
- Lee RainieNetworked18,99 €
-
-
-
While most books on statistics seem to be written as though targeting other statistics professors, John Reinard's Communication Research Statistics is especially impressive because it is clearly intended for the student reader, filled with unusually clear explanations and with illustrations on the use of SPSS. I enjoyed reading this lucid, student-friendly book and expect students will benefit enormously from its content and presentation. Well done!" --John C. Pollock, The College of New Jersey Written in an accessible style using straightforward and direct language, Communication Research Statistics guides students through the statistics actually used in most empirical research undertaken in communication studies. This introductory textbook is the only work in communication that includes details on statistical analysis of data with a full set of data analysis instructions based on SPSS 12 and Excel XP.
Hinweis: Dieser Artikel kann nur an eine deutsche Lieferadresse ausgeliefert werden.
Produktdetails
- Produktdetails
- Verlag: Sage Publications, Inc
- Seitenzahl: 604
- Erscheinungstermin: 20. April 2006
- Englisch
- Abmessung: 235mm x 191mm x 32mm
- Gewicht: 1111g
- ISBN-13: 9780761929871
- ISBN-10: 0761929878
- Artikelnr.: 21995772
- Herstellerkennzeichnung
- Produktsicherheitsverantwortliche/r
- Europaallee 1
- 36244 Bad Hersfeld
- gpsr@libri.de
John C. Reinard (Ph.D., Southern California) is a professor of Human Communication Studies at California State University, Fullerton. He regularly teaches graduate and undergraduate courses in research methods, quantitative research, persuasion, critical thinking, and argumentation. He received his Ph.D. from the University of Southern California in 1975, after which he served on the faculties at California Polytechnic State University, San Luis Obispo and Arizona State University. He also has served as a master instructor in statistical process control for Motorola. He is the author of Introduction to Research in Communication, soon to be published in its fourth edition, as well as Foundations of Argument. His research has focused primarily in the areas of communication and the law, persuasion, and argumentation. He has published his research in journals including Communication Monographs, the Journal of Communication, Human Communication Research, and Argumentation and Advocacy. He has authored over 100 books, articles, chapters, and research reports presented at professional meetings and conventions. He has served as an Associate Editor for the Journal of Communication, Human Communication Research, Communication Monographs, Argumentation and Advocacy, Communication Quarterly, Communication Reports, Communication Education, and the Western Journal of Communication. He has twice received his University's Author Award and has also been honored with its Outstanding Scholarly and Creative Activity Award. He has chaired five interest groups in professional organizations and has served on committees of three professional organizations. He lives with his wife in Southern California and in his spare time he plays the piano and is a gourmet chef.
Preface
Section One: Introduction to Statistical Analyses
1. Using Statistics to Conduct Quantitative Research
A World of Statistics
Why Do Quantitative Research?
Typical Steps Involved in Quantitative Research
2. Collecting Data on Variables
Variables and Hypotheses
Measurement of Variables
Sampling
Section Two: Descriptive Statistics
3. Central Tendency
Doing a Study and Reporting Descriptive Information
Typical Measures of Central Tendency
Relations among Mean Median and Mode
4. Looking at Variability and Dispersion
Assessing Dispersion
The Relationship Between Measures of Central Tendency and Variability
Examining Distributions
5. Correlations
The Notion of Correlation
Elements of the Correlation
Computing the Pearson Product-Moment Correlation
Matters Affecting Correlations
Methods of Correlations
Alternative Forms of Association
6. Ensuring Reliability and Validity
The Notion of Measurement Acceptability
How to Do a study of Measurement Adequacy
Reliability
Validity
The Relation of Validity to Reliability
Section Three: Inferential Statistics
7. Statistical Significance Hypothesis Testing when Comparing Two Means
Doing a Study that Tests a Hypothesis of Differences Between Means
Assumptions in Parametric Hypothesis Testing
Comparing Sample and Population Means
Comparing the Means of Two Sample Groups: The Two-Sample t Test
Comparing Means Differences of Paired Scores: The Paired Difference t
Assessing Power
8. Comparing More than Two Means: One-Way Analysis of Variance
Hypothesis Testing for More than Two Means
The Analysis of Variance Hypothesis Test
What after ANOVA? Multiple Comparison Tests
Extensions of Analysis of Variance
9. Factorial Analysis of Variance
Doing a Study that Involves More than One Independent Variable
Types of Effect to Test
Computing the Fixed-Effect ANOVA
Random and Mixed-Effects Designs
Section Four: Nonparametric Tests
10. Nonparametric Tests for Categorical Variables
The Notion of "Distribution-Free" Statistics
Conducting a Study that Requires Nonparametric Tests of Categorical Data
The Chi-Square Test
Alternatives to Chi-Square for Frequency Data
11. Nonparametric Tests for Rank Order Dependent Variables
Doing a Study Involving Ordinal Dependent Variables
Comparing Ranks of One Group to Presumed Populations Characteristics:
Analogous Tests to One-Sample t Tests
Comparing Ranks from Two Sample Groups
Comparing Ranks from More than Two Sample Groups: Analogous Tests to
One-Way ANOVA
Section Five: Advanced Statistical Applications
12. Meta-Analysis
Meta-Analysis: An Alternative to Artistic Literature Reviews
Conducting the Meta-Analysis Study
Using Computer Techniques to Perform Meta-Analysis
13. Multiple Regression Correlation
Contrasting Bivariate Correlation and Multiple Regression Correlation
Components of Multiple Correlations
How to Do a Multiple Regression Correlation Study
14. Extensions of Multiple Regression Correlation
Using Categorical Predictors
Contrasting Full and Reduced Models: Hierarchical Analysis
Interaction Effects
Examining Nonlinear Effects
15. Exploratory Factor Analysis
Forms of Factor Analysis
The Notion of Multivariate Analyses
Exploratory Factor Analysis
16. Confirmatory Factor Analysis Through the AMOS Program
The Notion of Confirmatory Factor Analysis
Using the AMOS Program for Confirmatory Factor Analysis
17. Modeling Communication Behavior
The Goals of Modeling
How to Do a Modeling Study
Path Models
Using the AMOS Program
Appendix A: Using Excel XP to Analyze Data
Getting Ready to Run Statistics With Excel
Handling Data
Using the Menu Bar
Toolbars
How to Run Statistics From the Analysis ToolPak
Using Functions
Appendix B: Using SPSS 12 for Windows
How to enter and Screen Your Own Data in SPSS
How to Enter Data From a Word Processor
How to Create Indexes From Scales
Commands in the SPSS System
Dealing With Output
Alternative Editing Environments
Appendix C: Tables
References
Index
About the Author