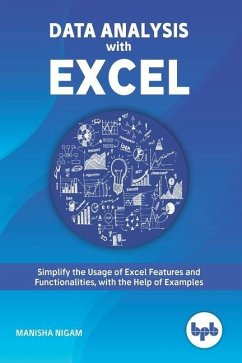
Simplify the Usage of Excel Features and Functionalities, with the Help of Examples Key Features 1. Basic components of excel, the available menu options and tools, some customizations working with multiple workbooks and worksheets, most frequently used and useful keyboard shortcuts. 2. An initial introduction to what are formulas, functions, and their components. 3. Usage of multiple examples to explain the application in real world scenario. 4. Explaining of different chart types available in Excel and how best it can be used for creating different views of data, good graphics, visualizations for dashboards, and so on. 5. Different ways and methods to consolidate data, complex analysis, and prediction or forecast based on trends. 6. Excel features that help in automating tasks. Description Book is written in a lucid manner to explain the concepts in details, with adequate emphasis on examples. The intent of this book is to explain and simplify the usage of Excel features and functionalities, with help of examples. Book will enable users in working efficiently and will increase their workplace productivity. It explains: 7. Functions for calculations 8. Graphing tools 9. Pivot tables 10. Data analysis tools 11. Micro programming 12. Add-ins that enable core complex operations. What You Will Learn 13. Performing functions with shortcut keys. 14. Formulas and functions 15. Data visualization with new chart types 16. Gantt and Milestone Chart 17. Smart Art and Organization Chart 18. Putting data in perspective with Pivots 19. Complex data analysis using Tool Pak 20. Forecasting in Excel 21. Mail Merge using Excel 22. Macros in Excel 23. What is in Excel 2019 Who This Book is For Anyone who wants to learn Excel, do the mundane task easily and quickly, do complex calculations, analysis huge data from internal or external sources, take decisions based on predictions, do forecasting, create plans and charts, monitor dashboards for progress and status, and so on. Table of Contents > 2. Perform Functions with Shortcut Keys 3. Formulas and Functions 4. Data Visualization with New Chart types 5. Gantt and Milestone Chart 6. SmartArt and Organization Chart 7. Putting Data in perspective with Pivots 8. Complex Data Analysis using ToolPak 9. Forecasting in Excel 10. Mail Merge using Excel 11. Macros in Excel. 12. What's in Excel 2019 About the Author Manisha Nigam is a seasoned management professional with twenty plus years of information technology experience, working with multinationals across the globe. Her expertise in Excel comes from the vast experience she has in using and understanding the software over the years, that helped her in working efficiently and managing complex programs. A certified PMP (PMI - Project Management Professional), CSM (Scrum Alliance - Scrum Master), TOGAF 9.1 (The Open Group - Enterprise Architecture) and holds a post-graduate degree in computer science and business management from prestigious universities in India. Her LinkedIn Profile: linkedin.com/in/mnigam10
Bitte wählen Sie Ihr Anliegen aus.
Rechnungen
Retourenschein anfordern
Bestellstatus
Storno


