- Broschiertes Buch
- Merkliste
- Auf die Merkliste
- Bewerten Bewerten
- Teilen
- Produkt teilen
- Produkterinnerung
- Produkterinnerung
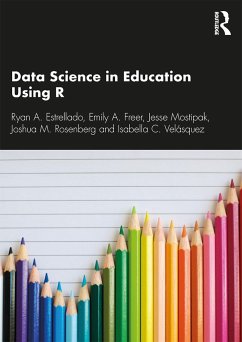
This book provides educational analysts and educators with practical tools to start working in data science and data analysis - using the data usefully that is generated by school districts, government agencies, and education businesses.
Andere Kunden interessierten sich auch für
![Reproducible Research with R and RStudio Reproducible Research with R and RStudio]() Christopher GandrudReproducible Research with R and RStudio75,99 €
Christopher GandrudReproducible Research with R and RStudio75,99 €![Exploring Data Science with R and the Tidyverse Exploring Data Science with R and the Tidyverse]() Jerry BonnellExploring Data Science with R and the Tidyverse106,99 €
Jerry BonnellExploring Data Science with R and the Tidyverse106,99 €![Hands-On Data Analysis in R for Finance Hands-On Data Analysis in R for Finance]() Jean-Francois CollardHands-On Data Analysis in R for Finance113,99 €
Jean-Francois CollardHands-On Data Analysis in R for Finance113,99 €![Practical R for Mass Communication and Journalism Practical R for Mass Communication and Journalism]() Sharon MachlisPractical R for Mass Communication and Journalism79,99 €
Sharon MachlisPractical R for Mass Communication and Journalism79,99 €![Introduction to Data Science Introduction to Data Science]() Rafael A IrizarryIntroduction to Data Science112,99 €
Rafael A IrizarryIntroduction to Data Science112,99 €![Telling Stories with Data Telling Stories with Data]() Rohan AlexanderTelling Stories with Data136,99 €
Rohan AlexanderTelling Stories with Data136,99 €![Data Science in Practice Data Science in Practice]() Tom AlbyData Science in Practice97,99 €
Tom AlbyData Science in Practice97,99 €-
-
-
This book provides educational analysts and educators with practical tools to start working in data science and data analysis - using the data usefully that is generated by school districts, government agencies, and education businesses.
Produktdetails
- Produktdetails
- Verlag: Taylor & Francis Ltd
- Seitenzahl: 306
- Erscheinungstermin: 27. Oktober 2020
- Englisch
- Abmessung: 244mm x 170mm x 17mm
- Gewicht: 612g
- ISBN-13: 9780367422257
- ISBN-10: 0367422255
- Artikelnr.: 60013266
- Herstellerkennzeichnung
- Libri GmbH
- Europaallee 1
- 36244 Bad Hersfeld
- gpsr@libri.de
Ryan A. Estrellado has served public schools for over seventeen years as a school psychologist and administrator. Ryan writes about working with data, education and other projects at https://ryanestrellado.com. Emily A. Freer is the Director of Educational Development and Assessment at the Marquette University School of Dentistry. Learn more about Emily at https://emilyfreer.com. Jesse Mostipak is the Community Advocate for Kaggle, and has worked both as a high school science teacher and lead data scientist within education non-profits. To follow Jesse's learning adventures in Python and deep learning, head over to https://jessemaegan.com. Joshua M. Rosenberg is an Assistant Professor of STEM Education at the University of Tennessee, Knoxville. Follow Josh's work at http://joshuamrosenberg.com. Isabella C. Velásquez is a data analyst committed to nonprofit work with the goal of reducing racial and socioeconomic inequities. To follow Isabella's personal projects, join her at https://ivelasq.rbind.io.
1. Introduction: Data Science in Education - You're Invited to the Party!
2. How to Use this Book 3. What Does Data Science in Education Look Like?
4. Special Considerations 5. Getting Started with R and RStudio 6.
Foundational Skills 7. Walkthrough 1: The Education Data Science Pipeline
with Online Science Class Data 8. Walkthrough 2: Approaching Gradebook Data
from a Data Science Perspective 9. Walkthrough 3: Using School-Level
Aggregate Data to Illuminate Educational Inequities 10. Walkthrough 4:
Longitudinal Analysis with Federal Students with Disabilities Data 11.
Walkthrough 5: Text Analysis with Social Media Data 12. Walkthrough 6:
Exploring Relationships Using Social Network Analysis with Social Media
Data 13. Walkthrough 7: The Role (and Usefulness) of Multilevel Models 14.
Walkthrough 8: Predicting Students' Final Grades Using Machine Learning
Methods with Online Course Data 15. Introducing Data Science Tools to Your
Education Job 16. Teaching Data Science 17. Learning More 18. Additional
Resources 19. Conclusion: Where to Next?

