Data Visualization for Success
Interviews with 40 Experienced Designers
Versandkostenfrei!
Versandfertig in über 4 Wochen
29,99 €
inkl. MwSt.

PAYBACK Punkte
15 °P sammeln!
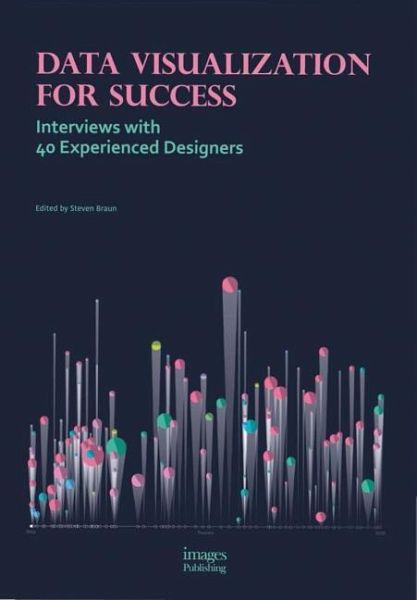
What is data visualization? In Data Visualization for Success, 40 designers and their works demonstrate that data visualization is a vibrant and constantly evolving field that is as multimodal as it is interdisciplinary. Through the works showcased here, these designers discuss some of their approaches to working with data visualisation, offering insight into the design methods they commonly use and providing tips that will help beginning practitioners in the field. This book shows that data visualization is a practice and discipline whose fluid boundaries continue to be moved in new, exciting...
What is data visualization? In Data Visualization for Success, 40 designers and their works demonstrate that data visualization is a vibrant and constantly evolving field that is as multimodal as it is interdisciplinary. Through the works showcased here, these designers discuss some of their approaches to working with data visualisation, offering insight into the design methods they commonly use and providing tips that will help beginning practitioners in the field. This book shows that data visualization is a practice and discipline whose fluid boundaries continue to be moved in new, exciting, and unprecedented directions by emerging and seasoned designers alike.


