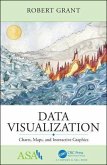
Data Visualization with Python: Create Stunning Dashboards and Insights Unlock the full potential of your data with Data Visualization with Python , the ultimate guide to transforming raw data into compelling, interactive dashboards and insightful visualizations. Designed for data analysts, scientists, and Python developers, this book provides step-by-step instructions on how to build visually appealing and meaningful visualizations using Python libraries like Matplotlib, Seaborn, and Plotly . Whether you're analyzing trends, making data-driven decisions, or presenting insights to stakeholders, this book will help you design stunning visuals that convey complex information clearly. With real-world examples, best practices, and hands-on projects, you'll learn how to create dynamic dashboards, interactive charts, and effective storytelling visualizations to communicate your findings with ease. What You'll Learn: ✅ Introduction to Data Visualization - Understand the principles of data visualization and the importance of choosing the right charts for your data. ✅ Matplotlib Basics - Learn how to create basic visualizations like line charts, bar charts, scatter plots, and histograms using Matplotlib. ✅ Advanced Visualizations with Seaborn - Dive into advanced techniques with Seaborn for creating heatmaps, violin plots, and pair plots to reveal deeper insights. ✅ Interactive Visualizations with Plotly - Use Plotly to create interactive charts, geospatial maps, and 3D plots for a more dynamic user experience. ✅ Data Preprocessing for Visualization - Prepare and clean data for visualization using Pandas, including missing data handling, aggregation, and grouping. ✅ Customizing Plots - Customize the look and feel of your visualizations with labels, titles, color palettes, and styling to make them more engaging. ✅ Building Dashboards with Dash - Learn how to use Dash to create powerful, interactive dashboards for real-time data updates and seamless user interaction. ✅ Working with Geospatial Data - Visualize location-based data using Plotly maps and GeoPandas to create maps with interactive zoom and tooltips. ✅ Time Series Data Visualization - Master techniques for plotting time series data, including date formatting, resampling, and trend analysis. ✅ Embedding Visualizations into Web Apps - Learn how to embed your visualizations and dashboards into web applications using Flask and Django . ✅ Data Storytelling - Use visualizations to tell a compelling data story, highlighting key trends, patterns, and insights for your audience. ✅ Optimizing Visualization Performance - Implement techniques for handling large datasets and optimizing your visualizations for better performance and scalability. ✅ Real-World Use Cases - Explore practical applications of data visualization in fields such as finance, healthcare, marketing, and sales. With hands-on projects, practical tips, and real-world case studies, Data Visualization with Python will equip you with the skills to turn complex data into stunning visual narratives that engage and inform your audience.
Hinweis: Dieser Artikel kann nur an eine deutsche Lieferadresse ausgeliefert werden.
Hinweis: Dieser Artikel kann nur an eine deutsche Lieferadresse ausgeliefert werden.


