- Gebundenes Buch
- Merkliste
- Auf die Merkliste
- Bewerten Bewerten
- Teilen
- Produkt teilen
- Produkterinnerung
- Produkterinnerung
The field of data mining lies at the confluence of predictive analytics, statistical analysis, and business intelligence. Due to the ever-increasing complexity and size of data sets and the wide range of applications in computer science, business, and health care, the process of discovering knowledge in data is more relevant than ever before. This book provides the tools needed to thrive in today's big data world. The author demonstrates how to leverage a company's existing databases to increase profits and market share, and carefully explains the most current data science methods and…mehr
Andere Kunden interessierten sich auch für
- Meta S. BrownData Mining For Dummies31,99 €
- Xiaohua Hu / Yi Pan (eds.)Knowledge Discovery in Bioinformatics170,99 €
- Joe MinichinoData Analytics in the AWS Cloud51,99 €
- Mark van der LooStatistical Data Cleaning with Applications in R101,99 €
- Stephane TufferyDeep Learning108,99 €
- Richard BrathGraph Analysis and Visualization56,99 €
- Claudio CarpinetoConcept Data Analysis149,99 €
-
-
-
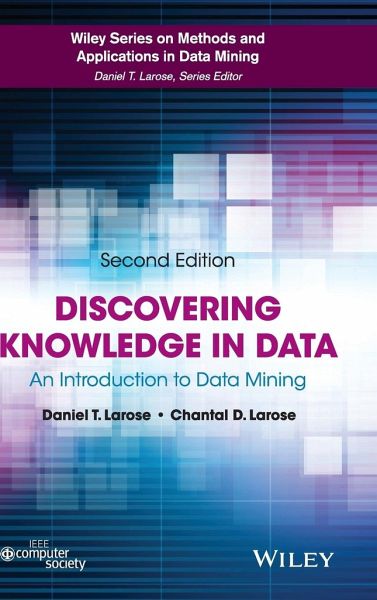
The field of data mining lies at the confluence of predictive analytics, statistical analysis, and business intelligence. Due to the ever-increasing complexity and size of data sets and the wide range of applications in computer science, business, and health care, the process of discovering knowledge in data is more relevant than ever before.
This book provides the tools needed to thrive in today's big data world. The author demonstrates how to leverage a company's existing databases to increase profits and market share, and carefully explains the most current data science methods and techniques. The reader will "learn data mining by doing data mining". By adding chapters on data modelling preparation, imputation of missing data, and multivariate statistical analysis, Discovering Knowledge in Data, Second Edition remains the eminent reference on data mining .
The second edition of a highly praised, successful reference on data mining, with thorough coverage of big data applications, predictive analytics, and statistical analysis.
Includes new chapters on Multivariate Statistics, Preparing to Model the Data, and Imputation of Missing Data, and an Appendix on Data Summarization and Visualization
Offers extensive coverage of the R statistical programming language
Contains 280 end-of-chapter exercises
Includes a companion website with further resources for all readers, and Powerpoint slides, a solutions manual, and suggested projects for instructors who adopt the book
Hinweis: Dieser Artikel kann nur an eine deutsche Lieferadresse ausgeliefert werden.
This book provides the tools needed to thrive in today's big data world. The author demonstrates how to leverage a company's existing databases to increase profits and market share, and carefully explains the most current data science methods and techniques. The reader will "learn data mining by doing data mining". By adding chapters on data modelling preparation, imputation of missing data, and multivariate statistical analysis, Discovering Knowledge in Data, Second Edition remains the eminent reference on data mining .
The second edition of a highly praised, successful reference on data mining, with thorough coverage of big data applications, predictive analytics, and statistical analysis.
Includes new chapters on Multivariate Statistics, Preparing to Model the Data, and Imputation of Missing Data, and an Appendix on Data Summarization and Visualization
Offers extensive coverage of the R statistical programming language
Contains 280 end-of-chapter exercises
Includes a companion website with further resources for all readers, and Powerpoint slides, a solutions manual, and suggested projects for instructors who adopt the book
Hinweis: Dieser Artikel kann nur an eine deutsche Lieferadresse ausgeliefert werden.
Produktdetails
- Produktdetails
- Wiley Series on Methods and Applications in Data Mining
- Verlag: Wiley & Sons
- Artikelnr. des Verlages: 14590874000
- 2. Aufl.
- Seitenzahl: 336
- Erscheinungstermin: 8. Juli 2014
- Englisch
- Abmessung: 240mm x 161mm x 23mm
- Gewicht: 671g
- ISBN-13: 9780470908747
- ISBN-10: 0470908742
- Artikelnr.: 33257382
- Herstellerkennzeichnung
- Libri GmbH
- Europaallee 1
- 36244 Bad Hersfeld
- 06621 890
Daniel T. Larose earned his PhD in Statistics at the University of Connecticut. He is Professor of Mathematical Sciences and Director of the Data Mining programs at Central Connecticut State University. His consulting clients have included Microsoft, Forbes Magazine, the CIT Group, KPMG International, Computer Associates, and Deloitte, Inc. This is Larose's fourth book for Wiley. Chantal D. Larose is an Assistant Professor of Statistics & Data Science at Eastern Connecticut State University (ECSU). She has co-authored three books on data science and predictive analytics. She helped develop data science programs at ECSU and at SUNY New Paltz. She received her PhD in Statistics from the University of Connecticut, Storrs in 2015 (dissertation title: Model-based Clustering of Incomplete Data).
Preface xi
Chapter 1 An Introduction to Data Mining 1
1.1 What is Data Mining? 1
1.2 Wanted: Data Miners 2
1.3 The Need for Human Direction of Data Mining 3
1.4 The Cross-Industry Standard Practice for Data Mining 4
1.4.1 Crisp-DM: The Six Phases 5
1.5 Fallacies of Data Mining 6
1.6 What Tasks Can Data Mining Accomplish? 8
1.6.1 Description 8
1.6.2 Estimation 8
1.6.3 Prediction 10
1.6.4 Classification 10
1.6.5 Clustering 12
1.6.6 Association 14
References 14
Exercises 15
Chapter 2 Data Preprocessing 16
2.1 Why do We Need to Preprocess the Data? 17
2.2 Data Cleaning 17
2.3 Handling Missing Data 19
2.4 Identifying Misclassifications 22
2.5 Graphical Methods for Identifying Outliers 22
2.6 Measures of Center and Spread 23
2.7 Data Transformation 26
2.8 Min-Max Normalization 26
2.9 Z-Score Standardization 27
2.10 Decimal Scaling 28
2.11 Transformations to Achieve Normality 28
2.12 Numerical Methods for Identifying Outliers 35
2.13 Flag Variables 36
2.14 Transforming Categorical Variables into Numerical Variables 37
2.15 Binning Numerical Variables 38
2.16 Reclassifying Categorical Variables 39
2.17 Adding an Index Field 39
2.18 Removing Variables that are Not Useful 39
2.19 Variables that Should Probably Not Be Removed 40
2.20 Removal of Duplicate Records 41
2.21 A Word About ID Fields 41
The R Zone 42
References 48
Exercises 48
Hands-On Analysis 50
Chapter 3 Exploratory Data Analysis 51
3.1 Hypothesis Testing Versus Exploratory Data Analysis 51
3.2 Getting to Know the Data Set 52
3.3 Exploring Categorical Variables 55
3.4 Exploring Numeric Variables 62
3.5 Exploring Multivariate Relationships 69
3.6 Selecting Interesting Subsets of the Data for Further Investigation 71
3.7 Using EDA to Uncover Anomalous Fields 71
3.8 Binning Based on Predictive Value 72
3.9 Deriving New Variables: Flag Variables 74
3.10 Deriving New Variables: Numerical Variables 77
3.11 Using EDA to Investigate Correlated Predictor Variables 77
3.12 Summary 80
The R Zone 82
Reference 88
Exercises 88
Hands-On Analysis 89
Chapter 4 Univariate Statistical Analysis 91
4.1 Data Mining Tasks in Discovering Knowledge in Data 91
4.2 Statistical Approaches to Estimation and Prediction 92
4.3 Statistical Inference 93
4.4 How Confident are We in Our Estimates? 94
4.5 Confidence Interval Estimation of the Mean 95
4.6 How to Reduce the Margin of Error 97
4.7 Confidence Interval Estimation of the Proportion 98
4.8 Hypothesis Testing for the Mean 99
4.9 Assessing the Strength of Evidence Against the Null Hypothesis 101
4.10 Using Confidence Intervals to Perform Hypothesis Tests 102
4.11 Hypothesis Testing for the Proportion 104
The R Zone 105
Reference 106
Exercises 106
Chapter 5 Multivariate Statistics 109
5.1 Two-Sample t-Test for Difference in Means 110
5.2 Two-Sample Z-Test for Difference in Proportions 111
5.3 Test for Homogeneity of Proportions 112
5.4 Chi-Square Test for Goodness of Fit of Multinomial Data 114
5.5 Analysis of Variance 115
5.6 Regression Analysis 118
5.7 Hypothesis Testing in Regression 122
5.8 Measuring the Quality of a Regression Model 123
5.9 Dangers of Extrapolation 123
5.10 Confidence Intervals for the Mean Value of y Given x 125
5.11 Prediction Intervals for a Randomly Chosen Value of y Given x 125
5.12 Multiple Regression 126
5.13 Verifying Model Assumptions 127
The R Zone 131
Reference 135
Exercises 135
Hands-On Analysis 136
Chapter 6 Preparing to Model the Data 138
6.1 Supervised Versus Unsupervised Methods 138
6.2 Statistical Methodology and Data Mining Methodology 139
6.3 Cross-Validation 139
6.4 Overfitting 141
6.5 BIAS-Variance Trade-Off 142
6.6 Balancing the Training Data Set 144
6.7 Establishing Baseline Performance 145
The R Zone 146
Reference 147
Exercises 147
Chapter 7 K-Nearest Neighbor Algorithm 149
7.1 Classification Task 149
7.2 k-Nearest Neighbor Algorithm 150
7.3 Distance Function 153
7.4 Combination Function 156
7.4.1 Simple Unweighted Voting 156
7.4.2 Weighted Voting 156
7.5 Quantifying Attribute Relevance: Stretching the Axes 158
7.6 Database Considerations 158
7.7 k-Nearest Neighbor Algorithm for Estimation and Prediction 159
7.8 Choosing k 160
7.9 Application of k-Nearest Neighbor Algorithm Using IBM/SPSS Modeler 160
The R Zone 162
Exercises 163
Hands-On Analysis 164
Chapter 8 Decision Trees 165
8.1 What is a Decision Tree? 165
8.2 Requirements for Using Decision Trees 167
8.3 Classification and Regression Trees 168
8.4 C4.5 Algorithm 174
8.5 Decision Rules 179
8.6 Comparison of the C5.0 and Cart Algorithms Applied to Real Data 180
The R Zone 183
References 184
Exercises 185
Hands-On Analysis 185
Chapter 9 Neural Networks 187
9.1 Input and Output Encoding 188
9.2 Neural Networks for Estimation and Prediction 190
9.3 Simple Example of a Neural Network 191
9.4 Sigmoid Activation Function 193
9.5 Back-Propagation 194
9.5.1 Gradient Descent Method 194
9.5.2 Back-Propagation Rules 195
9.5.3 Example of Back-Propagation 196
9.6 Termination Criteria 198
9.7 Learning Rate 198
9.8 Momentum Term 199
9.9 Sensitivity Analysis 201
9.10 Application of Neural Network Modeling 202
The R Zone 204
References 207
Exercises 207
Hands-On Analysis 207
Chapter 10 Hierarchical and K-Means Clustering 209
10.1 The Clustering Task 209
10.2 Hierarchical Clustering Methods 212
10.3 Single-Linkage Clustering 213
10.4 Complete-Linkage Clustering 214
10.5 k-Means Clustering 215
10.6 Example of k-Means Clustering at Work 216
10.7 Behavior of MSB, MSE, and PSEUDO-F as the k-Means Algorithm Proceeds
219
10.8 Application of k-Means Clustering Using SAS Enterprise Miner 220
10.9 Using Cluster Membership to Predict Churn 223
The R Zone 224
References 226
Exercises 226
Hands-On Analysis 226
Chapter 11 Kohonen Networks 228
11.1 Self-Organizing Maps 228
11.2 Kohonen Networks 230
11.2.1 Kohonen Networks Algorithm 231
11.3 Example of a Kohonen Network Study 231
11.4 Cluster Validity 235
11.5 Application of Clustering Using Kohonen Networks 235
11.6 Interpreting the Clusters 237
11.6.1 Cluster Profiles 240
11.7 Using Cluster Membership as Input to Downstream Data Mining Models 242
The R Zone 243
References 245
Exercises 245
Hands-On Analysis 245
Chapter 12 Association Rules 247
12.1 Affinity Analysis and Market Basket Analysis 247
12.1.1 Data Representation for Market Basket Analysis 248
12.2 Support, Confidence, Frequent Itemsets, and the a Priori Property 249
12.3 How Does the a Priori Algorithm Work? 251
12.3.1 Generating Frequent Itemsets 251
12.3.2 Generating Association Rules 253
12.4 Extension from Flag Data to General Categorical Data 255
12.5 Information-Theoretic Approach: Generalized Rule Induction Method 256
12.5.1 J-Measure 257
12.6 Association Rules are Easy to do Badly 258
12.7 How Can We Measure the Usefulness of Association Rules? 259
12.8 Do Association Rules Represent Supervised or Unsupervised Learning?
260
12.9 Local Patterns Versus Global Models 261
The R Zone 262
References 263
Exercises 263
Hands-On Analysis 264
Chapter 13 Imputation of Missing Data 266
13.1 Need for Imputation of Missing Data 266
13.2 Imputation of Missing Data: Continuous Variables 267
13.3 Standard Error of the Imputation 270
13.4 Imputation of Missing Data: Categorical Variables 271
13.5 Handling Patterns in Missingness 272
The R Zone 273
Reference 276
Exercises 276
Hands-On Analysis 276
Chapter 14 Model Evaluation Techniques 277
14.1 Model Evaluation Techniques for the Description Task 278
14.2 Model Evaluation Techniques for the Estimation and Prediction Tasks
278
14.3 Model Evaluation Techniques for the Classification Task 280
14.4 Error Rate, False Positives, and False Negatives 280
14.5 Sensitivity and Specificity 283
14.6 Misclassification Cost Adjustment to Reflect Real-World Concerns 284
14.7 Decision Cost/Benefit Analysis 285
14.8 Lift Charts and Gains Charts 286
14.9 Interweaving Model Evaluation with Model Building 289
14.10 Confluence of Results: Applying a Suite of Models 290
The R Zone 291
Reference 291
Exercises 291
Hands-On Analysis 291
Appendix: Data Summarization and Visualization 294
Index 309