Andy Field
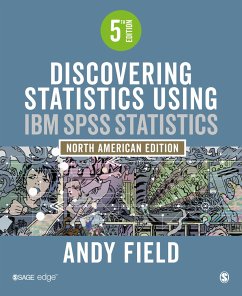
Discovering Statistics Using IBM SPSS Statistics
Schade – dieser Artikel ist leider ausverkauft. Sobald wir wissen, ob und wann der Artikel wieder verfügbar ist, informieren wir Sie an dieser Stelle.
Andy Field
Discovering Statistics Using IBM SPSS Statistics
- Broschiertes Buch
- Merkliste
- Auf die Merkliste
- Bewerten Bewerten
- Teilen
- Produkt teilen
- Produkterinnerung
- Produkterinnerung
- Weitere 7 Ausgaben:
- Gebundenes Buch
- Gebundenes Buch
- Broschiertes Buch
- eBook, ePUB
- eBook, ePUB
- eBook, PDF
- eBook, PDF
Unrivalled in the way it makes the teaching of statistics through the use of IBM SPSS statistics compelling and accessible to even the most anxious of students, the only statistics textbook you and your students will ever need just got better!
Andere Kunden interessierten sich auch für
![Grundlagen der Transkription Grundlagen der Transkription]() Susanne FußGrundlagen der Transkription14,90 €
Susanne FußGrundlagen der Transkription14,90 €![Linear Regression Linear Regression]() Damodar N GujaratiLinear Regression51,99 €
Damodar N GujaratiLinear Regression51,99 €![Social Statistics for a Diverse Society Social Statistics for a Diverse Society]() Chava Frankfort-NachmiasSocial Statistics for a Diverse Society178,99 €
Chava Frankfort-NachmiasSocial Statistics for a Diverse Society178,99 €![Study Guide for Psychology to Accompany Salkind and Frey′s Statistics for People Who (Think They) Hate Statistics Study Guide for Psychology to Accompany Salkind and Frey′s Statistics for People Who (Think They) Hate Statistics]() Neil J SalkindStudy Guide for Psychology to Accompany Salkind and Frey′s Statistics for People Who (Think They) Hate Statistics51,99 €
Neil J SalkindStudy Guide for Psychology to Accompany Salkind and Frey′s Statistics for People Who (Think They) Hate Statistics51,99 €![Generalized Linear Models Generalized Linear Models]() Jefferson M GillGeneralized Linear Models51,99 €
Jefferson M GillGeneralized Linear Models51,99 €![Interpreting Quantitative Data with IBM SPSS Statistics (Second Edition) Interpreting Quantitative Data with IBM SPSS Statistics (Second Edition)]() Rachad AntoniusInterpreting Quantitative Data with IBM SPSS Statistics (Second Edition)76,99 €
Rachad AntoniusInterpreting Quantitative Data with IBM SPSS Statistics (Second Edition)76,99 €![The Tao of Statistics The Tao of Statistics]() Dana K KellerThe Tao of Statistics51,99 €
Dana K KellerThe Tao of Statistics51,99 €-
-
Unrivalled in the way it makes the teaching of statistics through the use of IBM SPSS statistics compelling and accessible to even the most anxious of students, the only statistics textbook you and your students will ever need just got better!
Produktdetails
- Produktdetails
- Verlag: Sage Publications UK
- 5th edition
- Seitenzahl: 816
- Erscheinungstermin: 22. November 2017
- Englisch
- Abmessung: 279mm x 228mm x 30mm
- Gewicht: 1817g
- ISBN-13: 9781526436566
- ISBN-10: 1526436566
- Artikelnr.: 48894401
- Herstellerkennzeichnung
- Produktsicherheitsverantwortliche/r
- Europaallee 1
- 36244 Bad Hersfeld
- gpsr@libri.de
Andy Field is Professor of Quantitative Methods at the University of Sussex. He has published widely (100+ research papers, 29 book chapters, and 17 books in various editions) in the areas of child anxiety and psychological methods and statistics. His current research interests focus on barriers to learning mathematics and statistics. He is internationally known as a statistics educator. He has written several widely used statistics textbooks including Discovering Statistics Using IBM SPSS Statistics (winner of the 2007 British Psychological Society book award), Discovering Statistics Using R, and An Adventure in Statistics (shortlisted for the British Psychological Society book award, 2017; British Book Design and Production Awards, primary, secondary and tertiary education category, 2016; and the Association of Learned & Professional Society Publishers Award for innovation in publishing, 2016), which teaches statistics through a fictional narrative and uses graphic novel elements. He has also written the adventr and discovr packages for the statistics software R that teach statistics and R through interactive tutorials. His uncontrollable enthusiasm for teaching statistics to psychologists has led to teaching awards from the University of Sussex (2001, 2015, 2016, 2018, 2019), the British Psychological Society (2006) and a prestigious UK National Teaching fellowship (2010). He¿s done the usual academic things: had grants, been on editorial boards, done lots of admin/service but he finds it tedious trying to remember this stuff. None of them matter anyway because in the unlikely event that yoüve ever heard of him it¿ll be as the ¿Stats book guy¿. In his spare time, he plays the drums very noisily in a heavy metal band, and walks his cocker spaniel, both of which he finds therapeutic.
Chapter 1. Why is My Evil Lecturer Forcing Me to Learn Statistics? What the hell am I doing here? I don
t belong here The Research Process Initial observation: finding something that needs explaining Generating and testing theories and hypotheses Collecting data: measurement Collecting data: research design Analysing data Reporting data Chapter 2. The Spine of Statistiscs What will this chapter tell me? What is the SPINE of statistics? Statistical models Populations and samples P is for parameters E is for estimating parameters S is for standard error I is for (confidence) interval N is for null hypothesis significance testing Reporting significance tests Chapter 3. The Phoenix of Statistics Problems with NHST NHST as part of wider problems with science A phoenix from the EMBERS Sense, and how to use it Pre-registering research and open science Effect size Bayesian approaches Reporting effect sizes and Bayes factors Chapter 4. The IBM SPSS Statistics Environment Versions of IBM SPSS Statistics Windows, Mac OS, and Linux Getting started The data editor Entering data into IBM SPSS Statistics Importing data The SPSS viewer Exporting SPSS output The syntax editor Saving files Opening files Extending IBM SPSS Statistics Chapter 5. Exploring Data With Graphs The art of presenting data The SPSS Chart Builder Histograms Boxplots (box-whisker diagrams) Graphing means: bar charts and error bars Line charts Graphing relationships: the scatterplot Editing graphs Chapter 6. The Beast of Bias What is bias? Outliers Overview of assumptions Additivity and linearity Normally distributed something or other Homoscedasticity/homogeneity of variance Independence Spotting outliers Spotting normality Spotting linearity and heteroscedasticity/heterogeneity of variance Reducing bias Chapter 7. Non-Parametric Models When to use non-parametric tests General procedure of non-parametric tests in SPSS Comparing two independent conditions: the Wilcoxon rank-sum test and Mann-Whitney test Comparing two related conditions: the Wilcoxon signed-rank test Differences between several independent groups: the Kruskal-Wallis test Differences between several related groups: Friedman
s ANOVA Chapter 8. Correlation Modeling relationships Data entry for correlation analysis Bivariate correlation Partial and semi-partial correlation Comparaing correlations Calculating the effect size How to report correlation coefficents Chapter 9. Linear Model (Regression) An introduction to the linear model (regression) Bias linear models? Generalizing the model Sample size and the linear model Fitting linear models: the general procedure Using IBM SPPS Statistics to fit a linear model with one predictor Interpreting a linear model with one predictor Interpreting a linear model with two or more predictors (multiple regression) Using IBM SPSS Statistics to fit a linear model with several predictors Interpreting a linear model with several predictors Robust regression Bayesian regression Reporting linear models Chapter 10. Comparing Two Means Looking for differences An example: are invisible people mischievous? Categorical predictors in the linear model The t-test Assumptions of the t-test Comparaing two means: general procedure Comparing two independent means using IBM SPSS Statistics Comparing two related means using IBM SPSS Statistics Reporting comparisons between two means Between groups or repeated measures? Chapter 11. Moderation, Mediation and Multicategory Predictors The PROCESS tool Moderation: interactions in the linear model Mediation Categorical predictors in regression Chapter 12. GLM 1: Comparing Several Independent Means Using a linear model to compare several means Assumptions when comparing means Planned contrasts (contrast coding) Post hoc procedures Comparing several means using IBM SPSS Statistics Output from one-way independent ANOVA Robust comparisons of several means Bayesian comparisons of several means Calculating the effect size Reporting results from one-way independent ANOVA 12.15 Smart Alex
s tasks Chapter 13. GLM 2: Comparing Means Adjusted For Other Predictors (Analysis of Covariance) What is ANCOVA? ANCOVA and the general linear model Assumptions and issues in ANCOVA Conducting ANCOVA using IBM SPSS Statistics Interpreting ANCOVA Testing the assumption of homogeneity of regression slopes Robust ANCOVA Bayesian analysis with covariates Calculating the effect size Reporting results Chapter 14. GLM 3: Factorial Designs Factorial designs Independent factorial designs and the linear model Model assumptions in factorial designs Factorial designs using IBM SPSS Statistics Output from factorial designs Interpreting interaction graphs Robust models of factorial designs Bayesian models of factorial designs Calculating effect sizes Reporting results of two-way ANOVA Chapter 15. GLM 4: Repeated-Measures Designs Introduction to repeated-measures designs A grubby example Repeated-measures and the linear model The ANOVA approach to repeated-measures designs The F-statistics for repeated-measures designs Assumptions in repeated-measures designs One-way repeated-measures designs Chapter 16. GLM 5: Mixed Designs Mixed designs Assumptions in mixed designs A speed-dating example Mixed designs using IBM SPSS Statistics Output for mixed factorial designs Calculating effect sizes Reporting the results of mixed designes Chapter 17. Multivariate Analysis of Variance (MANOVA) Introducing MANOVA Introducing matrices The theory behind MANOVA Practical issues when conducting MANOVA MANOVA using IBM SPSS Statistics Interpreting MANOVA Reporting results from MANOVA Following up MANOVA with discriminant analysis Interpreting discriminant analysis Reporting results from discriminant analysis The final interpretation Chapter 18. Exploratory Factor Analysis When to use factor analysis Factors and components Discovering factors An anxious example Factor analysis uisng IBM SPSS Statistics Interpreting factor analysis How to report factor analysis Reliability analysis Reliability analysis using IBM SPSS Statistics Interpreting reliability analysis How to report reliability analysis Chapter 19. categorical Outcomes: Chi-Square and Loglinear Analysis Analysing categorical data Associations between two categorical variables Associations between several categorical variables: loglinear analysis Assumptions when analysisng categorical data General procedure for analysing categorical outcomes Doing chi-square uisng IBM SPSS Statistics Interpreting the chi-square test Loglinear analysis using IBM SPSS Statistics Interpreting loglinear analysis Reporting the results of loglinear analysis Chapter 20. Categorical Outcomes: Logistic Regression What is logitsic regression? Theory of logistic regression Sources of bias and common problems Binary logistic regression Interpreting logistic regression Reporting logistic regression Testing assumptions: another example Predicting several categories: multinominal logistic regression Reporting multinominal logistic regression Chapter 21. Multilevel Linear Models Hierarchical data Theory of multilevel linear models The multilevel model Some practical issues Multilevel modeling using IBM SPSS Statistics Growth models How to report a multilevel model A message from the octopus of inescapable despair Chapter 22. Epilouge

