Beschreibung
Produktdetails
Einband
Gebundene Ausgabe
Erscheinungsdatum
05.09.2003
Verlag
WileySeitenzahl
296
Maße (L/B/H)
24/16,1/2,1 cm
Gewicht
613 g
Sprache
Englisch
ISBN
978-0-470-85604-8
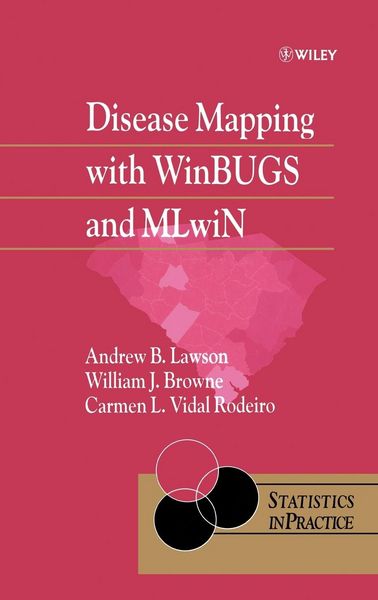
Disease mapping involves the analysis of geo-referenced disease incidence data and has many applications, for example within resource allocation, cluster alarm analysis, and ecological studies. There is a real need amongst public health workers for simpler and more efficient tools for the analysis of geo-referenced disease incidence data. Bayesian and multilevel methods provide the required efficiency, and with the emergence of software packages ? such as WinBUGS and MLwiN ? are now easy to implement in practice.
- Provides an introduction to Bayesian and multilevel modelling in disease mapping.
- Adopts a practical approach, with many detailed worked examples.
- Includes introductory material on WinBUGS and MLwiN.
- Discusses three applications in detail ? relative risk estimation, focused clustering, and ecological analysis.
- Suitable for public health workers and epidemiologists with a sound statistical knowledge.
- Supported by a Website featuring data sets and WinBUGS and MLwiN programs.
Disease Mapping with WinBUGS and MLwiN provides a practical introduction to the use of software for disease mapping for researchers, practitioners and graduate students from statistics, public health and epidemiology who analyse disease incidence data.
Noch keine Bewertungen vorhanden
Verfassen Sie die erste Bewertung zu diesem Artikel
Helfen Sie anderen Kundinnen und Kunden durch Ihre Meinung.
Kurze Frage zu unserer Seite
Vielen Dank für dein Feedback
Wir nutzen dein Feedback, um unsere Produktseiten zu verbessern. Bitte habe Verständnis, dass wir dir keine Rückmeldung geben können. Falls du Kontakt mit uns aufnehmen möchtest, kannst du dich aber gerne an unseren Kund*innenservice wenden.
zum Kundenservice