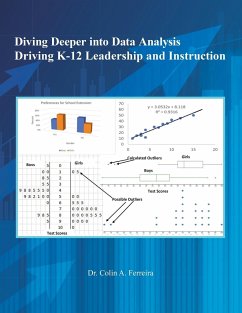
This textbook demystifies the complex Statistical calculations and difficulty in analyzing and interpreting assessment data by presenting simplified approaches for: ¿ Understanding data types and using appropriate graphical and numerical forms to describe data. ¿ Correctly reading and interpreting quantitative data and qualitative data presented in charts, tables, and graphs including pie charts, bar graphs, two-way tables, side-by-side bar graphs, segmented bar graphs, line graphs, histograms, dotplots, parallel boxplots, side-by-side stemplots, and scatter plots. ¿ Correctly reading and interpreting quantitative data presented in numerical forms including mean, median, standard deviation, range, interquartile range, percentiles, quartiles, and standardized scores (z-scores). ¿ Making data-driven decisions based on statistical calculations and interpretations. ¿ Using the results of prudent data analysis to drive leadership and instruction. ¿ Using the findings of extensive data analysis of assessment data to develop an innovative school improvement action plan.
Hinweis: Dieser Artikel kann nur an eine deutsche Lieferadresse ausgeliefert werden.
Hinweis: Dieser Artikel kann nur an eine deutsche Lieferadresse ausgeliefert werden.


