- Gebundenes Buch
- Merkliste
- Auf die Merkliste
- Bewerten Bewerten
- Teilen
- Produkt teilen
- Produkterinnerung
- Produkterinnerung
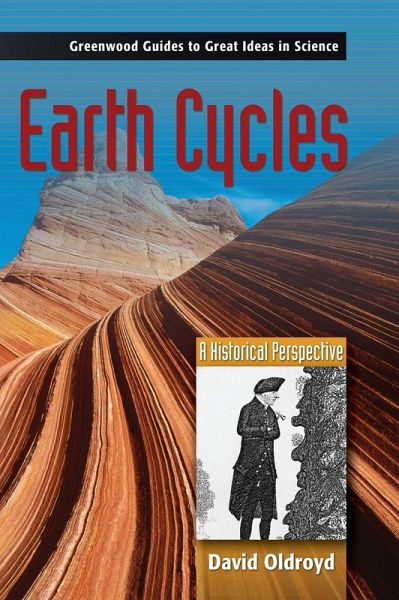
Humans have tried to figure out what formed the landscape of the earth for thousands of years. How were mountains created? Where did lakes and rivers come from? What lies under the surface of the earth? And one concept that greatly aided the scientific advance of the earth sciences was that of geological cycles. Once scientists understood that many geological actions are cyclic, the scientific knowledge of the earth exploded. These ideas are central to the nature of the earth sciences, and appreciating how scientists arrived at these ideas is essential for understanding the nature of the earth sciences.…mehr
Andere Kunden interessierten sich auch für
- The Natural Environment and the Biogeochemical Cycles83,99 €
- Georg SchaubEnergy Flows, Material Cycles and Global Development88,99 €
- Hua ZhangImpacts of Selenium on the Biogeochemical Cycles of Mercury in Terrestrial Ecosystems in Mercury Mining Areas74,99 €
- The Natural Environment and the Biogeochemical Cycles42,99 €
- Inverse Methods in Global Biogeochemical Cycles94,99 €
- Hua ZhangImpacts of Selenium on the Biogeochemical Cycles of Mercury in Terrestrial Ecosystems in Mercury Mining Areas74,99 €
-
-
-
Humans have tried to figure out what formed the landscape of the earth for thousands of years. How were mountains created? Where did lakes and rivers come from? What lies under the surface of the earth? And one concept that greatly aided the scientific advance of the earth sciences was that of geological cycles. Once scientists understood that many geological actions are cyclic, the scientific knowledge of the earth exploded. These ideas are central to the nature of the earth sciences, and appreciating how scientists arrived at these ideas is essential for understanding the nature of the earth sciences.
Hinweis: Dieser Artikel kann nur an eine deutsche Lieferadresse ausgeliefert werden.
Produktdetails
- Produktdetails
- Verlag: Greenwood
- Seitenzahl: 256
- Erscheinungstermin: 30. Juni 2006
- Englisch
- Abmessung: 260mm x 183mm x 18mm
- Gewicht: 683g
- ISBN-13: 9780313332296
- ISBN-10: 0313332290
- Artikelnr.: 21916564
- Herstellerkennzeichnung
- Books on Demand GmbH
- In de Tarpen 42
- 22848 Norderstedt
- info@bod.de
- 040 53433511
DAVID OLDROYD, University of New South Wales David Oldroyd is Honorary Visiting Professor in the School of History and Philosophy of Science at the University of New South Wales and was Secretary-General of the International Commission on the History of Geological Sciences for eight years. A recipient of awards for his historical work from the Geological Society of London, the Geological Society of America, and the Australian Commonwealth, he is the author of numerous articles and several books, including (in the geosciences): The Highlands Controversy: Constructing Geological Knowledge through Fieldwork in Nineteenth-century Britain, Sciences of the Earth: Studies in the History of Mineralogy and Geology, Thinking about the Earth: A History of Ideas in Geology, Earth, Water, Ice and Fire: Two Hundred Years of Geological Research in the English Lake District, and (with Jan Kozak and Victor Moreira) The Iconography of the Lisbon Earthquake.
Figure 2.1. Leonardo's "theory of the Earth" from his "Codex Leicester." (Leonardo d Vinci
2000
31) Figure 3.1a. Four stages in the Earth's development (Descartes 1656
151). Figure 3.1b. Further development of the Earth (Descartes 1656
155). Figure 3.2. Steno's scheme for the geological history of Tuscany (1669
unnumbered page
preceding ). Figure 3.3. Frontispiece to Burnet's Theory of the Earth (1684). Figure 3.4. Figure from Burnet's Theory of the Earth (1684
57). Figure 3.5. Formation of oceans and mountains due to collapse structures (Burnet 1697
227). Figure 4.1. The Earth
its envelope of water
and the initial directions of motion of freely falling objects at different latitudes
based on Hooke's account in his Posthumous Works. Figure 5.1. The "geostrophic cycle." Figure 5.2. Cross section of northern part of Arran
drawn by John Clerk
Jr.
1787. Figure 5.3. Geological sketch map of northern Arran showing likely line of section for Clerk's drawing (Figure 5.2). Figure 5.4. Unconformity at Loch Ranza
Arran
as figured by Archibald Geikie (1899). Figure 5.5. Profile of unconformity observed by Hutton near Jedburgh in 1787. Figure 5.6. Unconformity at Siccar Point. Figure 5.7. The evolving continuum of mineral substances from the residues of living organisms
according to Lamarck's Hydrogeology. Figure 6.1. The "Temple" of Serapis at Pozzuoli near Naples. Figure 6.2. Illustration of Lyell's theory of "random" creation and extinction of species. Figure 7.1. Development of canyon profiles according to the hardness of strata (Dutton 1882
plate 40
facing p. 250). Figure 7.2. Evolution of a landscape according to Davis
from Holmes (1944
187). Figure 8.1. Part of the Earth's pentagonal arrangement of mountain ranges (Élie de Beaumont 1852
vol. 3
plate 5). Figure 8.2. Cooling
contracting globe (Dana 1847a
181). Figure 8.3. Depiction of Dana's ideas on mountain building
as reconstructed by Dott (1997
299). Figure 8.4. Folds and dislocations due to (a) lateral compression (b) subsidence
according to Suess. Figure 8.5. Suess's model of mountain building (S¿engör 1982
400
fig. 4). Figure 8.6. Breakup of Pangea
according to Wegener's Origin of Continents and Oceans (1966
18-19). Figure 8.7. Convection currents within the Earth's mantle
producing continental drift (Holmes 1929
579). Figure 8.8. Development of geosynclines and the formation of mountains (Holmes 1929
582). Figure 8.9. Convection currents within the Earth (Holmes 1944
506). Figure 8.10. Magnetization of the rocks of the ocean floor off the coast of western Canada (Mason and Raff 1961
1268). Figure 8.11. The "ideal" Bouma sequence
as depicted by Bouma (1962
49). Figure 8.12. Hypothetical form of the deposition cone of a turbidity current and hypothetical filling of a basin by turbidites. Figure 9.1. Global changes in temperature over time (Agassiz 1837). Figure 9.2. Earth's orbit around the Sun
illustrating the phenomenon of precession. Figure 9.3. Changes of the Earth's alignment in space
at periods of high orbital ellipticity
as depicted by Croll (1875
frontispiece). Figure 9.4. Milankovic's radiation graphs for 55°
60°
and 65°N
as published in Köppen and Wegener (1924
plate facing p. 256). Figure 9.5. Components of the variations of the Earth's motion in space
through time (Berger 1988
636). Figure 10.1. Sediment record in a sinking basin undergoing oscillations in base level (Barrell 1917
796). Figure 10.2. Sedimentation cycles (Udden 1912
27). Figure 10.3. Correlations of strata in western Illinois (Wanless 1931
189). Figure 10.4. Ideal cyclothem (Willman and Payne 1942
86). Figure 10.5a. Cyclothems (Holliday Drive
Kansas City
by the southern bank of the Kansas River
near its junction with the Missouri River). Figure 10.5b. Limestone with shale partings (Holliday Drive
Kansas City). Figure 10.6. De Geer examining varves in Vermont
1920. Figure 11.1. Generalized section from the Pacific to the Rockies (northwestern United States) (Wheeler 1958
1052). Figure 11.2. Time-stratigraphic diagram
representing the sequences depicted in Figure 11.1 (Wheeler 1958
1053). Figure 11.3. Time-stratigraphic relationships for sequences of the North American craton (Sloss 1963
110). Figure 11.4. The Vail curve
as unveiled in 1977
with two levels of resolution (Vail et al. 1977a
84). Figure 11.5. Conversion of data obtained from seismic stratigraphy into part of a Vail curve (Vail et al. 1977a
78). Figure 11.6. The "averaging" of sea-level curves from four different regions to yield a global sea-level curve
right-hand drawing (Vail et al. 1977b
90). Figure 11.7. Profile of a typical sequence and a corresponding Wheeler diagram (Haq et al. 1987
1157). Figure 12.1. Part of the geomagnetic time scale (Hoffman 1988
55). Figure 12.2. Variations of oxygen isotope composition with depth for two species of foraminifera for a Caribbean core (V12-122) (Broecker and Van Donk 1970
175). Figure 12.3. Comparison of oxygen isotope ratios and magnetic polarities for Lamont Core V28-238 (Shackleton and Opdyke 1973
48
fig. 9). Figure 13.1. Nieuwenkamp's "persedimentary" model of the continuous rock series (Nieuwenkamp 1968
366
fig. 1). Figure 13.2. The "crust-ocean factory" (Garrels and Mackenzie 1971
330). Figure 13.3. The "steady-state flow net" (Garrels and Perry 1974
313). Figure 13.4. Comparison of d13C carbonate and d34S sulfate isotope curves for Phanerozoic time (Holser et al. 1988
139
140). Figure 13.5. Comparison through the Phanerozoic of d13Ooxidized and d13Oreduced
reduced carbon/total carbon
and sea levels (Pigott 1981
fig. 15).