Allan G. Bluman
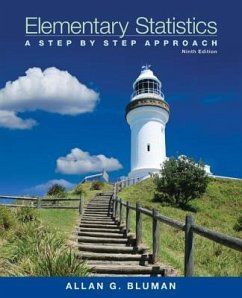
Elementary Statistics: A Step-By-Step Approach with Formula Card
Allan G. Bluman
Elementary Statistics: A Step-By-Step Approach with Formula Card
- Gebundenes Buch
- Merkliste
- Auf die Merkliste
- Bewerten Bewerten
- Teilen
- Produkt teilen
- Produkterinnerung
- Produkterinnerung
Features introductory statistics courses with a basic algebra prerequisite. This title follows a nontheoretical approach, explaining concepts intuitively and supporting them with abundant examples.
Andere Kunden interessierten sich auch für
![Statistics: Learning from Data Statistics: Learning from Data]() Roxy Peck (San Luis Obispo California Polytechnic State UniversityStatistics: Learning from Data298,99 €
Roxy Peck (San Luis Obispo California Polytechnic State UniversityStatistics: Learning from Data298,99 €![Black Belt Statistics: A Competency-Based Approach (Plus SPSS and R) Black Belt Statistics: A Competency-Based Approach (Plus SPSS and R)]() Thomas SawyerBlack Belt Statistics: A Competency-Based Approach (Plus SPSS and R)199,99 €
Thomas SawyerBlack Belt Statistics: A Competency-Based Approach (Plus SPSS and R)199,99 €![Visualizing Health Care Statistics: A Data-Mining Approach Visualizing Health Care Statistics: A Data-Mining Approach]() Zada T WickerVisualizing Health Care Statistics: A Data-Mining Approach94,99 €
Zada T WickerVisualizing Health Care Statistics: A Data-Mining Approach94,99 €![Business Statistics: A Decision Making Approach, Global Edition Business Statistics: A Decision Making Approach, Global Edition]() David GroebnerBusiness Statistics: A Decision Making Approach, Global Edition98,99 €
David GroebnerBusiness Statistics: A Decision Making Approach, Global Edition98,99 €![Statistics: Informed Decisions Using Data, Global Edition Statistics: Informed Decisions Using Data, Global Edition]() Michael SullivanStatistics: Informed Decisions Using Data, Global Edition123,99 €
Michael SullivanStatistics: Informed Decisions Using Data, Global Edition123,99 €![Statistics: A Tool for Social Research and Data Analysis Statistics: A Tool for Social Research and Data Analysis]() Joseph Healey (Christopher Newport University)Statistics: A Tool for Social Research and Data Analysis110,99 €
Joseph Healey (Christopher Newport University)Statistics: A Tool for Social Research and Data Analysis110,99 €![Compendium of Tourism Statistics: 28th Edition, 2008 Compendium of Tourism Statistics: 28th Edition, 2008]() World Tourism OrganizationCompendium of Tourism Statistics: 28th Edition, 2008161,99 €
World Tourism OrganizationCompendium of Tourism Statistics: 28th Edition, 2008161,99 €-
-
-
Features introductory statistics courses with a basic algebra prerequisite. This title follows a nontheoretical approach, explaining concepts intuitively and supporting them with abundant examples.
Hinweis: Dieser Artikel kann nur an eine deutsche Lieferadresse ausgeliefert werden.
Hinweis: Dieser Artikel kann nur an eine deutsche Lieferadresse ausgeliefert werden.
Produktdetails
- Produktdetails
- Statistics
- Verlag: McGraw-Hill Education - Europe
- 9 Revised edition
- Altersempfehlung: 18 bis 22 Jahre
- Erscheinungstermin: 11. November 2013
- Englisch
- Abmessung: 282mm x 221mm x 33mm
- Gewicht: 1910g
- ISBN-13: 9780078136337
- ISBN-10: 0078136334
- Artikelnr.: 40029198
- Herstellerkennzeichnung
- Libri GmbH
- Europaallee 1
- 36244 Bad Hersfeld
- gpsr@libri.de
Allan G. Bluman is a professor emeritus at the Community College of Allegheny County, South Campus, near Pittsburgh. He has taught mathematics and statistics for over 35 years. He received an Apple for the Teacher award in recognition of his bringing excellence to the learning environment at South Campus. He has also taught statistics for Penn State University at the Greater Allegheny (McKeesport) Campus and at the Monroeville Center. He received his master's and doctor's degrees from the University of Pittsburgh. In addition to Elementary Statistics: A Step by Step Approach (Eighth Edition ï¿2012) and Elementary Statistics: A Brief Version (Fifth Edition ï¿2010), Al is a co-author on a liberal arts mathematics text published by McGraw-Hill, Math in Our World (2nd Edition ï¿2011). Al also the author of for mathematics books in the McGraw-Hill DeMystified Series. They are Pre-Algebra, Math Word Problems, Business Math, and Probability. Al Bluman is married and has two sons and a granddaughter.
1 The Nature of Probability and Statistics1.1 Descriptive and Inferential
Statistics
1.2 Variables and Types of Data
1.3 Data Collection and Sampling Techniques
1.4 Observational and Experimental Studies
1.5 Uses and Misuses of Statistics
1.6 Computers and Calculators
2 Frequency Distributions and Graphs2.1 Organizing Data
2.2 Histograms, Frequency Polygons,and Ogives
2.3 Other Types of Graphs
3 Data Description3.1 Measures of CentralTendency
3.2 Measures of Variation
3.3 Measures of Position
3.4 Exploratory Data Analysis
4 Probability and Counting Rules4.1 Exploratory Data Analysis
4.2 The Addition Rules for Probability
4.3 The Multiplication Rules and ConditionalProbability
4.4 Counting Rules
4.5 Probability and Counting Rules
5 Discrete Probability Distributions5.1 Probability Distributions
5.2 Mean, Variance, Standard Deviation,and Expectation
5.3 The Binomial Distribution
5.4 Other Types of Distributions (Optional)
6 The Normal Distribution6.1 Normal Distributions
6.2 Applications of the NormalDistribution
6.3 The Central Limit Theorem
6.4 The Normal Approximation to the BinomialDistribution
7 Confidence Intervals and Sample Size7.1 Confidence Intervals for the Mean
When s Is Known
7.2 Confidence Intervals for the Mean When s Is Unknown
7.3 Confidence Intervals and Sample Size for Proportions
7.4 Confidence Intervals for Variances and Standard Deviations
8 Hypothesis Testing8.1 Steps in Hypothesis Testing-Traditional Method
8.2 z Test for a Mean
8.3 t Test for a Mean
8.4 z Test for a Proportion
8.5 ¿2 Test for a Variance or Standard Deviation
8.6 Additional Topics Regarding Hypothesis Testing
9 Testing the Difference Between Two Means, Two Variances, and Two
Proportions9.1 Testing the Difference Between Two Means: Using the z Test
9.2 Testing the Difference Between Two Means of Independent Samples: Using
the t Test
9.3 Testing the Difference Between Two Means: Dependent Samples
9.4 Testing the Difference Between Proportions9.5 Testing the Difference
Between Two Variances
10 Correlation and Regression10.1 Scatter Plots and Correlation
10.2 Regression
10.3 Coefficient of Determination and Standard Error of the Estimate
10.4 Multiple Regression (Optional)
11 Other Chi-Square Tests11.1 Test for Goodness of Fit
11.2 Tests Using Contingency Tables
12 Analysis of Variance12.1 One-Way Analysis of Variance
12.2 The Scheffe Test and the Tukey Test
12.3 Two-Way Analysis of Variance
13 Nonparametric Statistics13.1 Advantages and Disadvantages of
Nonparametric Methods
13.2 The Sign Test
13.3 The Wilcoxon Rank Sum Test
13.4 The Wilcoxon Signed-Rank Test
13.5 The Kruskal-Wallis Test
13.6 The Spearman Rank Correlation Coefficient and the Runs Test
14 Sampling and Simulation14.1 Common Sampling Techniques
14.2 Surveys and Questionnaire Design
14.3 Simulation Techniques and the Monte Carlo Method
AppendicesAppendix A: Tables
Appendix B: Data Bank
Appendix C: Glossary
Appendix D: Photos Credits
Appendix E: Selected Answers
Additional Topics OnlneAlgebra Review
Writing the Research Report
Bayes' Theorem
Alternate Approach to the Standard Normal Distribution
Bibliography

