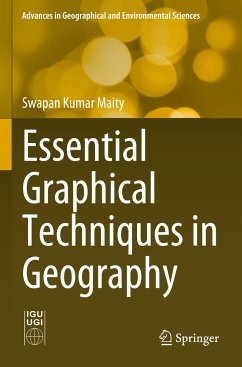
Representation of geographical data using graphs, diagrams and mapping techniques is a key for geographers and for researchers in other disciplines to explore the nature of data, the pattern of spatial and temporal variations and their relationships, and formulation of principles to accurately understand and analyze features on or near the earth's surface. These modes of representation also enable the development of spatial understanding and the capacity for technical and logical decision making. The book depicts all types of graphs, diagrams and maps, explained in detail with numerous examples. The emphasis is on their appropriate data structure, the relevance of selecting the correct technique, methods of their construction, advantages and disadvantages of their use, and applications of these techniques in analyzing and realizing the spatial pattern of various geographical features and phenomena. This book is unique in that it reflects a perfect correlation between theoreticalknowledge of geographical events and phenomena and their realistic implications, with relevant examples using appropriate graphical methods. The book serves as a valuable resource for students, researchers, cartographers and decision makers to analyze and represent various geographical data for a better, systematic and scientific understanding of the real world.
Bitte wählen Sie Ihr Anliegen aus.
Rechnungen
Retourenschein anfordern
Bestellstatus
Storno


