Gregory J Privitera, Kristin L Sotak, Yu Lei
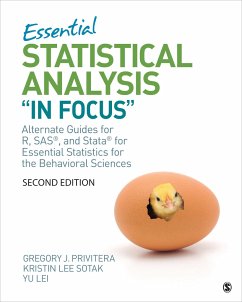
Essential Statistical Analysis in Focus
Alternate Guides for R, Sas, and Stata for Essential Statistics for the Behavioral Sciences
Gregory J Privitera, Kristin L Sotak, Yu Lei
Essential Statistical Analysis in Focus
Alternate Guides for R, Sas, and Stata for Essential Statistics for the Behavioral Sciences
- Broschiertes Buch
- Merkliste
- Auf die Merkliste
- Bewerten Bewerten
- Teilen
- Produkt teilen
- Produkterinnerung
- Produkterinnerung
Essential Statistics for the Behavioral Sciences, Second Edition, this text helps students to practice their skills and offers ‘In Focus’ sections for those using R, SAS or STATA as opposed to SPSS or Excel.
Andere Kunden interessierten sich auch für
![Learning and Memory Learning and Memory]() Darrell S RudmannLearning and Memory236,99 €
Darrell S RudmannLearning and Memory236,99 €![Social Psychology Social Psychology]() Thomas HeinzenSocial Psychology232,99 €
Thomas HeinzenSocial Psychology232,99 €![Sensation and Perception Sensation and Perception]() Bennett L SchwartzSensation and Perception232,99 €
Bennett L SchwartzSensation and Perception232,99 €![Cognitive Psychology Cognitive Psychology]() Dawn M McbrideCognitive Psychology236,99 €
Dawn M McbrideCognitive Psychology236,99 €![Social Psychology Social Psychology]() Daniel W BarrettSocial Psychology199,99 €
Daniel W BarrettSocial Psychology199,99 €![Children′s Thinking Children′s Thinking]() David F BjorklundChildren′s Thinking178,99 €
David F BjorklundChildren′s Thinking178,99 €![Psychopathology Psychopathology]() William J RayPsychopathology236,99 €
William J RayPsychopathology236,99 €-
-
-
Essential Statistics for the Behavioral Sciences, Second Edition, this text helps students to practice their skills and offers ‘In Focus’ sections for those using R, SAS or STATA as opposed to SPSS or Excel.
Hinweis: Dieser Artikel kann nur an eine deutsche Lieferadresse ausgeliefert werden.
Hinweis: Dieser Artikel kann nur an eine deutsche Lieferadresse ausgeliefert werden.
Produktdetails
- Produktdetails
- Verlag: Sage Publications
- 2nd edition
- Seitenzahl: 216
- Erscheinungstermin: 21. Juni 2018
- Englisch
- Abmessung: 251mm x 203mm x 13mm
- Gewicht: 431g
- ISBN-13: 9781544325842
- ISBN-10: 1544325843
- Artikelnr.: 49801702
- Herstellerkennzeichnung
- Produktsicherheitsverantwortliche/r
- Europaallee 1
- 36244 Bad Hersfeld
- gpsr@libri.de
Gregory J. Privitera is a professor of psychology at St. Bonaventure University where he is a recipient of its highest teaching honor, The Award for Professional Excellence in Teaching, and its highest honor for scholarship, The Award for Professional Excellence in Research and Publication. Dr. Privitera received his PhD in behavioral neuroscience in the field of psychology at the State University of New York at Buffalo and continued with his postdoctoral research at Arizona State University. He is a nationally award-winning author and research scholar. His textbooks span across diverse topics in psychology and the behavioral sciences, including an introductory psychology text, four statistics texts, two research methods texts, and multiple other texts bridging knowledge creation across health, health care, and analytics. In addition, Dr. Privitera has authored more than three dozen peer-reviewed papers aimed at advancing our understanding of health and informing policy in health care. His research has earned recognition by the American Psychological Association, and in media to include Oprah's Magazine, Time Magazine, and the Wall Street Journal. He mentors a variety of undergraduate research projects at St. Bonaventure University, where dozens of students, many of whom have gone on to earn graduate and doctoral degrees at various institutions, have coauthored and presented research work. In addition to his teaching, research, and advisement, Dr. Privitera is a veteran of the U.S. Marine Corps, is an identical twin, and is married with two daughters, Grace Ann and Charlotte Jane, and two sons, Aiden Andrew and Luca James.
About the Authors
About This Supplemental Guide
PART I. ANALYSIS IN FOCUS: R
R in Focus
To the Student-How to Use R With This Book
1.7 Entering and Defining Variables (p. 24)
2.4 Frequency Distributions for Quantitative Data (p. 47)
2.7 Frequency Distributions for Categorical Data (p. 52)
2.11 Histograms, Bar Charts, and Pie Charts (p. 62)
3.6 Mean, Median, and Mode (p. 94)
4.10 Range, Variance, and Standard Deviation (p. 124)
5.10 Converting Raw Scores to Standard z Scores (p. 155)
6.6 Estimating the Standard Error of the Mean (p. 178)
8.8 One-Sample t Test and Confidence Intervals (p. 244)
9.8 Two-Independent-Sample t Test and Confidence Intervals (p. 270)
10.7 The Related-Samples t Test and Confidence Intervals (p. 298)
11.5 The One-Way Between-Subjects ANOVA (p. 332)
11.9 The One-Way Within-Subjects ANOVA (p. 348)
12.7 The Two-Way Between-Subjects ANOVA (p. 393)
13.4 Pearson Correlation Coefficient (p. 419)
13.7 Computing the Alternatives to Pearson (p. 432)
13.11 Analysis of Regression (p. 445)
14.3 The Chi-Square Goodness-of-Fit Test (p. 468)
14.7 The Chi-Square Test for Independence (p. 480)
General Instructions Guide
PART II. ANALYSIS IN FOCUS: SAS
SAS in Focus
To the Student-How to Use SAS With This Book
1.7 Entering and Defining Variables (p. 24)
2.4 Frequency Distributions for Quantitative Data (p. 47)
2.7 Frequency Distributions for Categorical Data (p. 52)
2.11 Histograms, Bar Charts, and Pie Charts (p. 62)
3.6 Mean, Median, and Mode (p. 94)
4.10 Range, Variance, and Standard Deviation (p. 124)
5.10 Converting Raw Scores to Standard z Scores (p. 155)
6.6 Estimating the Standard Error of the Mean (p. 178)
8.8 One-Sample t Test and Confidence Intervals (p. 244)
9.8 Two-Independent-Sample t Test and Confidence Intervals (p. 270)
10.7 The Related-Samples t Test and Confidence Intervals (p. 298)
11.5 The One-Way Between-Subjects ANOVA (p. 332)
11.9 The One-Way Within-Subjects ANOVA (p. 348)
12.7 The Two-Way Between-Subjects ANOVA (p. 393)
13.4 Pearson Correlation Coefficient (p. 419)
13.7 Computing the Alternatives to Pearson (p. 432)
13.11 Analysis of Regression (p. 445)
14.3 The Chi-Square Goodness-of-Fit Test (p. 468)
14.7 The Chi-Square Test for Independence (p. 480)
General Instructions Guide
PART III. ANALYSIS IN FOCUS: STATA
Stata in Focus
To the Student-How to Use Stata With This Book
1.7 Entering and Defining Variables (p. 24)
2.4 Frequency Distributions for Quantitative Data (p. 47)
2.7 Frequency Distributions for Categorical Data (p. 52)
2.11 Histograms, Bar Charts, and Pie Charts (p. 62)
3.6 Mean, Median, and Mode (p. 94)
4.10 Range, Variance, and Standard Deviation (p. 124)
5.10 Converting Raw Scores to Standard z Scores (p. 155)
6.6 Estimating the Standard Error of the Mean (p. 178)
8.8 One-Sample t Test and Confidence Intervals (p. 244)
9.8 Two-Independent-Sample t Test and Confidence Intervals (p. 270)
10.7 The Related-Samples t Test and Confidence Intervals (p. 298)
11.5 The One-Way Between-Subjects ANOVA (p. 332)
11.9 The One-Way Within-Subjects ANOVA (p. 348)
12.7 The Two-Way Between-Subjects ANOVA (p. 393)
13.4 Pearson Correlation Coefficient (p. 419)
13.7 Computing the Alternatives to Pearson (p. 432)
13.11 Analysis of Regression (p. 445)
14.3 The Chi-Square Goodness-of-Fit Test (p. 468)
14.7 The Chi-Square Test for Independence (p. 480)
General Instructions Guide
References
Index

