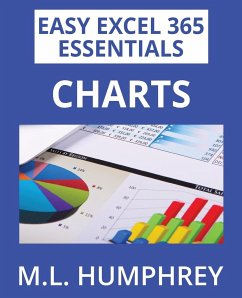
Charts are a great way to visualize data. Sometimes numbers can be overwhelming, but a quick picture based on those numbers makes trends and patterns very clear. This book covers how to work with charts in Excel on a general basis as well as some of the more popular chart types, specifically bar and column charts, pie and doughnut charts, line and area charts, scatter and bubble plots, and histograms. * * * This book is part of the Easy Excel 365 Essentials series of titles. These are targeted titles that are excerpted from the main Excel 365 Essentials series and are focused on one specific topic. If you want a more general introduction to Excel, then you should check out the Excel 365 Essentials titles instead. In this case, Intermediate Excel 365 which covers charts as well as a number of other topics, such as pivot tables and conditional formatting.
Hinweis: Dieser Artikel kann nur an eine deutsche Lieferadresse ausgeliefert werden.
Hinweis: Dieser Artikel kann nur an eine deutsche Lieferadresse ausgeliefert werden.


