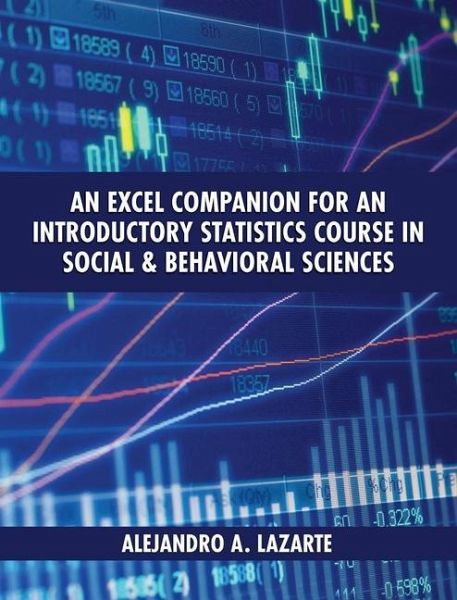
Excel Companion for an Introductory Statistics Course in Social and Behavioral Sciences
Versandkostenfrei!
Versandfertig in über 4 Wochen
117,99 €
inkl. MwSt.

PAYBACK Punkte
59 °P sammeln!
An Excel Companion for an Introductory Statistics Course in Social and Behavioral Sciences introduces students to the use of Excel to perform basic and intermediate data analyses that are common in the social and behavioral sciences. The companion focuses on using Excel to perform the types of analyses covered in most textbooks within the discipline. The book covers computations of descriptive statistics, hypothesis testing for means up to one-way ANOVA, correlation, and simple linear regression. Students learn how to perform summation in Excel, build pivot tables, and create compelling and ac...
An Excel Companion for an Introductory Statistics Course in Social and Behavioral Sciences introduces students to the use of Excel to perform basic and intermediate data analyses that are common in the social and behavioral sciences. The companion focuses on using Excel to perform the types of analyses covered in most textbooks within the discipline. The book covers computations of descriptive statistics, hypothesis testing for means up to one-way ANOVA, correlation, and simple linear regression. Students learn how to perform summation in Excel, build pivot tables, and create compelling and accurate distribution graphs. Measures of central tendency, variability, and location are covered. Additional chapters explore normal distribution, random numbers, probability distributions, cross tabulations, and more. All Excel computations described in the companion rely on basic Excel functions and the Data Analysis ToolPak add-on that comes with Excel. Highly practical and accessible, An Excel Companion for an Introductory Statistics Course in Social and Behavioral Sciences is an ideal supplementary text for introductory statistics courses.


