- Broschiertes Buch
- Merkliste
- Auf die Merkliste
- Bewerten Bewerten
- Teilen
- Produkt teilen
- Produkterinnerung
- Produkterinnerung
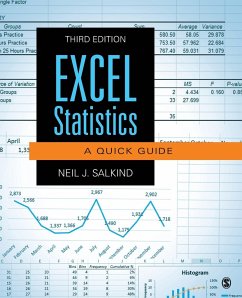
Ideal for those already familiar with basic Excel features, this updated Third Edition shows readers how to utilize Microsoft Excel's functions and Analysis ToolPak to answer simple and complex questions about data.
Andere Kunden interessierten sich auch für
![Straightforward Statistics with Excel Straightforward Statistics with Excel]() Chieh-Chen BowenStraightforward Statistics with Excel156,99 €
Chieh-Chen BowenStraightforward Statistics with Excel156,99 €![Business Statistics Using Excel Business Statistics Using Excel]() R. PanneerselvamBusiness Statistics Using Excel54,99 €
R. PanneerselvamBusiness Statistics Using Excel54,99 €![Statistics for People Who (Think They) Hate Statistics - International Student Edition Statistics for People Who (Think They) Hate Statistics - International Student Edition]() Neil J. SalkindStatistics for People Who (Think They) Hate Statistics - International Student Edition138,99 €
Neil J. SalkindStatistics for People Who (Think They) Hate Statistics - International Student Edition138,99 €![Statistics Statistics]() Frederick L. CoolidgeStatistics165,99 €
Frederick L. CoolidgeStatistics165,99 €![An R Companion for Applied Statistics II An R Companion for Applied Statistics II]() Danney Rasco (West Texas A & USA M University)An R Companion for Applied Statistics II77,99 €
Danney Rasco (West Texas A & USA M University)An R Companion for Applied Statistics II77,99 €![A Crash Course in Statistics A Crash Course in Statistics]() Ryan J. WinterA Crash Course in Statistics47,99 €
Ryan J. WinterA Crash Course in Statistics47,99 €![Using IBM® SPSS® Statistics for Research Methods and Social Science Statistics Using IBM® SPSS® Statistics for Research Methods and Social Science Statistics]() William E. Wagner-HuangUsing IBM® SPSS® Statistics for Research Methods and Social Science Statistics77,99 €
William E. Wagner-HuangUsing IBM® SPSS® Statistics for Research Methods and Social Science Statistics77,99 €-
-
-
Ideal for those already familiar with basic Excel features, this updated Third Edition shows readers how to utilize Microsoft Excel's functions and Analysis ToolPak to answer simple and complex questions about data.
Hinweis: Dieser Artikel kann nur an eine deutsche Lieferadresse ausgeliefert werden.
Hinweis: Dieser Artikel kann nur an eine deutsche Lieferadresse ausgeliefert werden.
Produktdetails
- Produktdetails
- Verlag: SAGE Publications Inc
- 3 Revised edition
- Seitenzahl: 168
- Erscheinungstermin: 1. Juli 2015
- Englisch
- Abmessung: 235mm x 191mm x 9mm
- Gewicht: 292g
- ISBN-13: 9781483374048
- ISBN-10: 1483374041
- Artikelnr.: 42139127
- Herstellerkennzeichnung
- Libri GmbH
- Europaallee 1
- 36244 Bad Hersfeld
- gpsr@libri.de
Neil J. Salkind received his PhD in human development from the University of Maryland, and after teaching for 35 years at the University of Kansas, he was Professor Emeritus in the Department of Psychology and Research in Education, where he collaborated with colleagues and work with students. His early interests were in the area of children's cognitive development, and after research in the areas of cognitive style and (what was then known as) hyperactivity, he was a postdoctoral fellow at the University of North Carolina's Bush Center for Child and Family Policy. His work then changed direction to focus on child and family policy, specifically the impact of alternative forms of public support on various child and family outcomes. He delivered more than 150 professional papers and presentations; written more than 100 trade and textbooks; and is the author of Statistics for People Who (Think They) Hate Statistics (SAGE), Theories of Human Development (SAGE), and Exploring Research (Prentice Hall). He has edited several encyclopedias, including the Encyclopedia of Human Development, the Encyclopedia of Measurement and Statistics, and the Encyclopedia of Research Design. He was editor of Child Development Abstracts and Bibliography for 13 years. He lived in Lawrence, Kansas, where he liked to read, swim with the River City Sharks, work as the proprietor and sole employee of big boy press, bake brownies (see www.statisticsforpeople.com for the recipe), and poke around old Volvos and old houses.
PART I: Using Excel Functions
1. Computing Averages
The AVERAGE Function
The AVERAGE A Function
The MEDIAN Function
The MODE.SNGL Function
The MODE.MULT Function
GEOMEAN Function
2. Looking at Variability
The STDEV.S Function
The STDEV.P Function
The VAR.S Function
The VAR.P Function
3. Describing Data
The FREQUENCY Function
The NORM.DIST Function
The PERCENTILE.INC Function
The PERCENTRANK.INC Function
The QUARTILE.INC Function
The RANK.AVG Function
The STANDARDIZE Function
4. Looking at Relationships
The COVARIANCE.S Function
The CORREL Function
The PEARSON Function
The INTERCEPT Function
The SLOPE Function
The TREND Function
The FORECAST Function
The RSQ Function
5. Testing Independence
The CHISQ.DIST Function
The CHISQ.TEST Function
6. Testing Significance
The F.DIST Function
The CONFIDENCE.NORM Function
The F.TEST Function
The T.DIST Function
The T.TEST Function
The Z.TEST Function
7. Looking at Data
The SMALL Function
The LARGE Function
The AVERAGEW IF Function
The COUNT Function
The COUNTA Function
The COUNTBLANK Function
The COUNTIF Function
PART II: Using the Analysis ToolPak
8. Describing Data
Descriptive Statistics
Moving Average
Random Number Generation
Rank and Percentile
Sampling
9. Comparing Means
z-Test: Two-Sample for Means
t-Test: Paired Two-Sample for Means
t-Test: Two-Sample Assuming Unequal Variances
t-Test: Two-Sample Assuming Equal Variances
Anova: Single Factor
Anova: Two-Factor With Replication
Anova: Two-Factor Without Replication
10. Looking at Relationships
The Correlation Tool
The Regression Tool
11. Illustrating Data
The Histogram Tool

