- Broschiertes Buch
- Merkliste
- Auf die Merkliste
- Bewerten Bewerten
- Teilen
- Produkt teilen
- Produkterinnerung
- Produkterinnerung
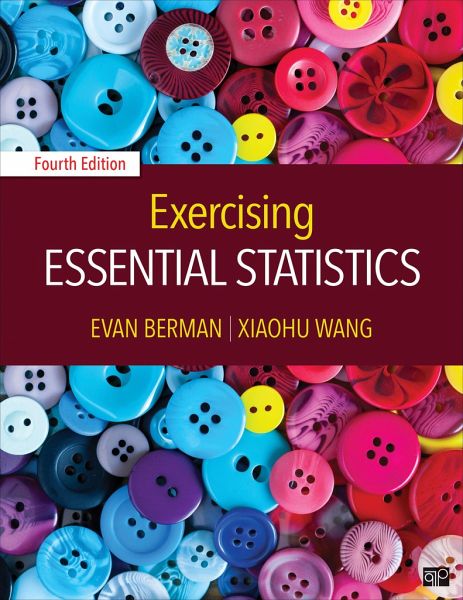
This workbook accompanies Essential Statistics for Public Managers and Policy Analysts, and gives students the opportunity to practice techniques through hands-on, carefully crafted exercises.
Andere Kunden interessierten sich auch für
- Evan M BermanEssential Statistics for Public Managers and Policy Analysts158,99 €
- John FoxRegression Diagnostics51,99 €
- Christine B HarringtonAdministrative Law and Politics257,99 €
- The Trusted Leader92,99 €
- Craig E JohnsonMeeting the Ethical Challenges of Leadership134,99 €
- Gus MartinTerrorism and Homeland Security193,99 €
- Gaspare M GennaExploring Politics135,99 €
-
-
-
This workbook accompanies Essential Statistics for Public Managers and Policy Analysts, and gives students the opportunity to practice techniques through hands-on, carefully crafted exercises.
Hinweis: Dieser Artikel kann nur an eine deutsche Lieferadresse ausgeliefert werden.
Produktdetails
- Produktdetails
- Verlag: Sage Publications
- 4th edition
- Seitenzahl: 184
- Erscheinungstermin: 31. Januar 2017
- Englisch
- Abmessung: 277mm x 213mm x 10mm
- Gewicht: 476g
- ISBN-13: 9781506348957
- ISBN-10: 1506348955
- Artikelnr.: 47148498
- Herstellerkennzeichnung
- Libri GmbH
- Europaallee 1
- 36244 Bad Hersfeld
- 06621 890
Evan M. Berman is Professor of Public Management and Director of Internationalization at Victoria University of Wellington, School of Government. Prior, he was the Huey McElveen Distinguished Professor at Louisiana State University. His areas of expertise are human resource management, public performance, local government, and public governance in Asia. He is past Chair of the American Society for Public Administration's Section of Personnel and Labor Relations. He has over 125 publications and 12 books, including People Skills At Work (CRC Press, 2011), Essential Statistics for Public Managers and Policy Analysts, Third Edition (CQ Press, 2012), and a trilogy of books on Public Administration in Asia (2010, 2011, 2013, CRC Press). He has published in all major journals of the discipline, is Senior Editor of Public Performance & Management Review, a Distinguished Fulbright Scholar, past University Chair Professor at National Chengchi University (Taipei, Taiwan), and a former policy analyst with the National Science Foundation.
Introduction
Chapter 1 Why Statistics for Public Managers and Analysts?
Q & A
Critical Thinking
Application Exercises
Further Reading
Chapter 2 Research Design
Q & A
Critical Thinking
Application Exercises
Further Reading
Chapter 3 Conceptualization and Measurement
Q & A
Critical Thinking
Application Exercises
Further Reading
Chapter 4 Measuring and Managing Performance: Present and Future
Q & A
Critical Thinking
Application Exercises
Further Reading
Chapter 5 Data Collection
Q & A
Critical Thinking
Application Exercises
Further Reading
Chapter 6 Central Tendency
Q & A
Critical Thinking
Data-Based Exercises
Further Reading
Chapter 7 Measures of Dispersion
Q & A
Critical Thinking
Data-Based Exercises
Further Reading
Chapter 8 Contingency Tables
Q & A
Critical Thinking
Data-Based Exercises
Further Reading
Chapter 9 Getting Results
Q & A
Critical Thinking
Data-Based Exercises
Further Reading
Chapter 10 Introducing Inference: Estimation from Samples
Q & A
Critical Thinking
Data-Based Exercises
Further Reading
Chapter 11 Hypothesis Testing with Chi-Square
Q & A
Critical Thinking
Data-Based Exercises
Further Reading
Chapter 12 The T-Test
Q & A
Critical Thinking
Data-Based Exercises
Further Reading
Chapter 13 Analysis of Variance (ANOVA)
Q & A
Critical Thinking
Data-Based Exercises
Further Reading
Chapter 14 Simple Regression
Q & A
Critical Thinking
Data-Based Exercises
Further Reading
Chapter 15 Multiple Regression
Q & A
Critical Thinking
Data-Based Exercises
Further Reading
Chapter 16 Logistic Regression and Time Series Regression
Q & A
Critical Thinking
Data-Based Exercises
Further Reading
Chapter 17 Survey of Other Techniques
Q & A
Critical Thinking
Data-Based Exercise
Further Reading
Chapter 18 Excel User's Guide
Loading the Data Analysis ToolPak
Locating the Insert Function (fx)
The Excel Sheet Screen and Descriptive Statistics Procedure
Frequency Distributions
Chi-Square Test
One-Sample T-Test
Two-Samples T-Test
ANOVA
Regression
Creating Charts in Excel
Chapter 19 SPSS User's Guide
SPSS Screens
Creating a Variable
Univariate Analysis: Means and Frequency Distributions
Variable Labels and Values
Defining Missing Values
Selecting a Subset of Observations for Analysis
Index Variables I: Cronbach Alpha
Index Variables II: Construction
Recoding Data
Hypothesis Testing with Chi-Square
T-Tests
Conclusion
Chapter 20 Dataset Documentation
Public Perceptions
Employee Attitudes
Community Indicators
Watershed
Productivity
Crime
Time
Florida County Conservation Spending Database