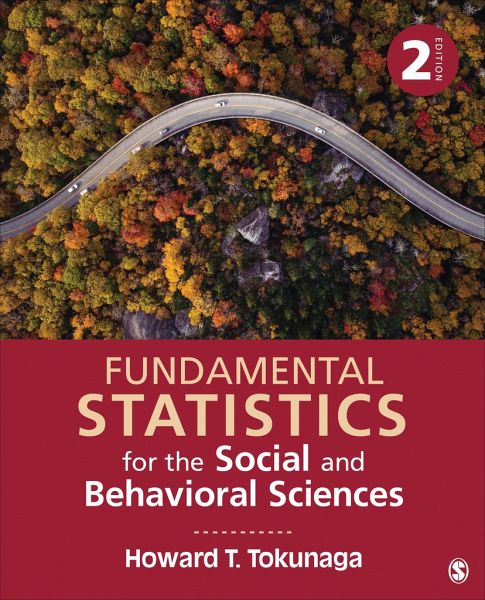
Howard T Tokunaga
Fundamental Statistics for the Social and Behavioral Sciences
Howard T Tokunaga
Fundamental Statistics for the Social and Behavioral Sciences
- Broschiertes Buch
- Merkliste
- Auf die Merkliste
- Bewerten Bewerten
- Teilen
- Produkt teilen
- Produkterinnerung
- Produkterinnerung
Fundamental Statistics is designed not to just teach students how to calculate statistics, but how to interpret the results of statistical analyses in light of a research hypothesis, and to communicate the results and interpretations to a broader audience.
Andere Kunden interessierten sich auch für
- Neil J SalkindStatistics for People Who (Think They) Hate Statistics Using R167,99 €
- Andy FieldDiscovering Statistics Using R81,99 €
- Brigitte Le RouxMultiple Correspondence Analysis50,99 €
- John AldrichLinear Probability Logit & Probit Models51,99 €
- Chaitra H. NagarajaMeasuring Society53,99 €
- M. Kraska-MillerNonparametric Statistics for Social and Behavioral Sciences91,99 €
- Jeremy J FosterData Analysis Using SPSS for Windows - Version 672,99 €
-
-
-
Fundamental Statistics is designed not to just teach students how to calculate statistics, but how to interpret the results of statistical analyses in light of a research hypothesis, and to communicate the results and interpretations to a broader audience.
Hinweis: Dieser Artikel kann nur an eine deutsche Lieferadresse ausgeliefert werden.
Produktdetails
- Produktdetails
- Verlag: Sage Publications
- 2nd edition
- Seitenzahl: 712
- Erscheinungstermin: 22. Oktober 2018
- Englisch
- Abmessung: 254mm x 203mm x 23mm
- Gewicht: 1315g
- ISBN-13: 9781506377483
- ISBN-10: 1506377483
- Artikelnr.: 52906153
- Herstellerkennzeichnung
- Libri GmbH
- Europaallee 1
- 36244 Bad Hersfeld
- 06621 890
Howard T. Tokunaga is Professor of Psychology at San Jose State University, where he serves as Coordinator of the MS Program in Industrial/Organizational (I/O) Psychology and teaches undergraduate and graduate courses in statistics, research methods, and I/O psychology. He received his bachelor's degree in psychology at UC Santa Cruz and his PhD in psychology at UC Berkeley. In addition to his teaching, he has consulted with a number of public-sector and private-sector organizations on a wide variety of management and human resource issues. He is coauthor (with G. Keppel) of Introduction to Design and Analysis: A Student's Handbook.
About the Author
Preface to the Second Edition
Preface to the First Edition
Acknowledgments
Companion Site
Chapter 1. Introduction to Statistics
1.1 What Is Statistics?
1.2 Why Learn Statistics?
1.3 Introduction to the Stages of the Research Process
1.4 Plan of the Book
1.5 Looking Ahead
1.6 Summary
1.7 Important Terms
1.8 Exercises
Chapter 2. Examining Data: Tables and Figures
2.1 An Example From the Research: Winning the Lottery
2.2 Why Examine Data?
2.3 Examining Data Using Tables
2.4 Grouped Frequency Distribution Tables
2.5 Examining Data Using Figures
2.6 Examining Data: Describing Distributions
2.7 Looking Ahead
2.8 Summary
2.9 Important Terms
2.10 Formulas Introduced in This Chapter
2.11 Using IBM SPSS Software
2.12 Exercises
Chapter 3. Measures of Central Tendency
3.1 An Example From the Research: The 10% Myth
3.2 Understanding Central Tendency
3.3 The Mode
3.4 The Median
3.5 The Mean
3.6 Comparison of the Mode, Median, and Mean
3.7 Measures of Central Tendency: Drawing Conclusions
3.8 Looking Ahead
3.9 Summary
3.10 Important Terms
3.11 Formulas Introduced in This Chapter
3.12 Exercises
Chapter 4. Measures of Variability
4.1 An Example From the Research: How Many "Sometimes" in an "Always"?
4.2 Understanding Variability
4.3 The Range
4.4 The Interquartile Range
4.5 The Variance (s2)
4.6 The Standard Deviation (s)
4.7 Measures of Variability for Populations
4.8 Measures of Variability for Nominal Variables
4.9 Measures of Variability: Drawing Conclusions
4.10 Looking Ahead
4.11 Summary
4.12 Important Terms
4.13 Formulas Introduced in This Chapter
4.14 Using SPSS
4.15 Exercises
Chapter 5. Normal Distributions
5.1 Example: SAT Scores
5.2 Normal Distributions
5.3 The Standard Normal Distribution
5.4 Applying z-Scores to Normal Distributions
5.5 Standardizing Frequency Distributions
5.6 Looking Ahead
5.7 Summary
5.8 Important Terms
5.9 Formulas Introduced in This Chapter
5.10 Exercises
Chapter 6. Probability and Introduction to Hypothesis Testing
6.1 A Brief Introduction to Probability
6.2 Example: Making Heads or Tails of the Super Bowl
6.3 Introduction to Hypothesis Testing
6.4 Issues Related to Hypothesis Testing: An Introduction
6.5 Looking Ahead
6.6 Summary
6.7 Important Terms
6.8 Formulas Introduced in This Chapter
6.9 Exercises
Chapter 7. Testing One Sample Mean
7.1 An Example From the Research: Do You Read Me?
7.2 The Sampling Distribution of the Mean
7.3 Inferential Statistics: Testing One Sample Mean (s Known)
7.4 A Second Example From the Research: Unique Invulnerability
7.5 Introduction to the t-Distribution
7.6 Inferential Statistics: Testing One Sample Mean (s Not Known)
7.7 Factors Affecting the Decision About the Null Hypothesis
7.8 Looking Ahead
7.9 Summary
7.10 Important Terms
7.11 Formulas Introduced in This Chapter
7.12 Using SPSS
7.13 Exercises
Chapter 8. Estimating the Mean of a Population
8.1 An Example From the Research: Salary Survey
8.2 Introduction to the Confidence Interval for the Mean
8.3 The Confidence Interval for the Mean (s Not Known)
8.4 The Confidence Interval for the Mean (s Known)
8.5 Factors Affecting the Width of the Confidence Interval for the Mean
8.6 Interval Estimation and Hypothesis Testing
8.7 Looking Ahead
8.8 Summary
8.9 Important Terms
8.10 Formulas Introduced in This Chapter
8.11 Using SPSS
8.12 Exercises
Chapter 9. Testing the Difference Between Two Means
9.1 An Example From the Research: You Can Just Wait
9.2 The Sampling Distribution of the Difference
9.3 Inferential Statistics: Testing the Difference Between Two Sample Means
9.4 Inferential Statistics: Testing the Difference Between Two Sample Means
(Unequal Sample Sizes)
9.5 Inferential Statistics: Testing the Difference Between Paired Means
9.6 Looking Ahead
9.7 Summary
9.8 Important Terms
9.9 Formulas Introduced in This Chapter
9.10 Using SPSS
9.11 Exercises
Chapter 10. Errors in Hypothesis Testing, Statistical Power, and Effect
Size
10.1 Hypothesis Testing vs. Criminal Trials
10.2 An Example From the Research: Truth or Consequences
10.3 Two Errors in Hypothesis Testing: Type I and Type II Error
10.4 Controlling Type I and Type II Error
10.5 Measures of Effect Size
10.6 Looking Ahead
10.7 Summary
10.8 Important Terms
10.9 Formulas Introduced in This Chapter
10.10 Exercises
Chapter 11. One-Way Analysis of Variance (ANOVA)
11.1 An Example From the Research: It's Your Move
11.2 Introduction to Analysis of Variance (ANOVA)
11.3 Inferential Statistics: One-Way Analysis of Variance (ANOVA)
11.4 A Second Example: The Parking Lot Study Revisited
11.5 Analytical Comparisons Within the One-Way ANOVA
11.6 Looking Ahead
11.7 Summary
11.8 Important Terms
11.9 Formulas Introduced in This Chapter
11.10 Using SPSS
11.11 Exercises
Chapter 12. Two-Way Analysis of Variance (ANOVA)
12.1 An Example From the Research: Vote-or Else!
12.2 Introduction to Factorial Research Designs
12.3 The Two-Factor (A × B) Research Design
12.4 Introduction to Analysis of Variance (ANOVA) for the Two-Factor
Research Design
12.5 Inferential Statistics: Two-Way Analysis of Variance (ANOVA)
12.6 Investigating a Significant A × B Interaction Effect: Analysis of
Simple Effects
12.7 Looking Ahead
12.8 Summary
12.9 Important Terms
12.10 Formulas Introduced in This Chapter
12.11 Using SPSS
12.12 Exercises
Chapter 13. Correlation
13.1 An Example From the Research: It's Good for You!
13.2 Introduction to the Concept of Correlation
13.3 Inferential Statistics: Pearson Correlation Coefficient
13.4 Correlating Two Sets of Ranks: The Spearman Rank-Order Correlation
13.5 Correlational Statistics vs. Correlational Research
13.6 Looking Ahead
13.7 Summary
13.8 Important Terms
13.9 Formulas Introduced in This Chapter
13.10 Using SPSS
13.11 Exercises
Chapter 14. Linear Regression and Multiple Correlation
14.1 Predicting One Variable From Another: Linear Regression
14.2 Correlation With Two or More Predictors: Introduction to Multiple
Correlation and Regression
14.3 Looking Ahead
14.4 Summary
14.5 Important Terms
14.6 Formulas Introduced in This Chapter
14.7 Using SPSS
14.8 Exercises
Chapter 15. Chi-Square
15.1 An Example From the Research (One Categorical Variable): Are You My
Type?
15.2 Introduction to the Chi-Square Statistic
15.3 Inferential Statistic: Chi-Square Goodness-of-Fit Test
15.4 An Example From the Research (Two Categorical Variables): Seeing Red
15.5 Inferential Statistic: Chi-Square Test of Independence
15.6 Parametric and Nonparametric Statistical Tests
15.7 Looking Ahead
15.8 Summary
15.9 Important Terms
15.10 Formulas Introduced in This Chapter
15.11 Using SPSS
15.12 Exercises
Tables
Appendix: Review of Basic Mathematics
Glossary
References
Index