Fundamentals of Statistical Reasoning in Education 4th Edition, like the first three editions, is written largely with students of education in mind. Accordingly, Theodore Coladarci, Casey D. Cobb, Edward W. Minium, and Robert C. Clarke have drawn primarily on examples and issues found in school settings, such as those having to do with instruction, learning, motivation, and assessment. The emphasis on educational applications notwithstanding, the authors are confident that readers will find Fundamentals of Statistical Reasoning in Education 4th Edition of general relevance to other…mehr
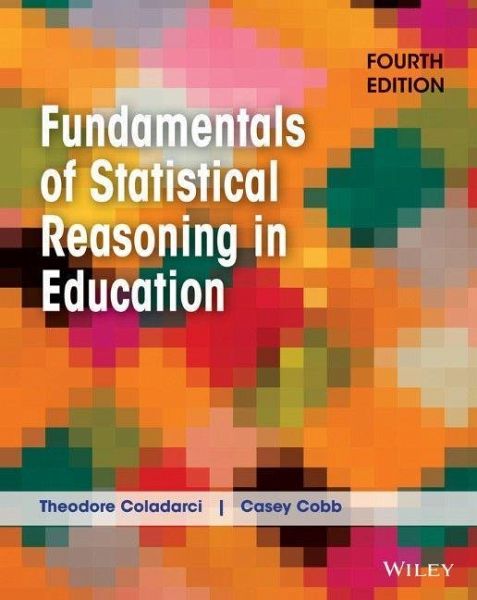
Fundamentals of Statistical Reasoning in Education 4th Edition, like the first three editions, is written largely with students of education in mind. Accordingly, Theodore Coladarci, Casey D. Cobb, Edward W. Minium, and Robert C. Clarke have drawn primarily on examples and issues found in school settings, such as those having to do with instruction, learning, motivation, and assessment. The emphasis on educational applications notwithstanding, the authors are confident that readers will find Fundamentals of Statistical Reasoning in Education 4th Edition of general relevance to other disciplines in the behavioral sciences as well.
The 4th Edition of Fundamentals is still designed as a "one semester" book. The authors intentionally sidestep topics that few introductory courses cover (e.g., factorial analysis of variance, repeated measures analysis of variance, multiple regression). At the same time, effect size and confidence intervals are incorporated throughout, which today are regarded as essential to good statistical practice.Hinweis: Dieser Artikel kann nur an eine deutsche Lieferadresse ausgeliefert werden.
Theodore Coladarci is Professor of Educational Psychology at the University of Maine. He has published extensively, including Elementary Descriptive Statistics, which he co-authored with A.P. Coladarci. Casey D. Cobb is the Raymond Neag Professor of Educational Policy at the Neag School of Education at the University of Connecticut. His current research interests include policies on school choice, accountability, and school reform, where he examines the implications for equity and educational opportunity. He is also co-author of Leading dynamic schools (Corwin Press), and has published in such journals as Educational Evaluation and Policy Analysis, Educational Policy, Education and Urban Society, Educational Leadership, and Review of Research in Education.
Inhaltsangabe
Chapter 1 Introduction 1
1.1 Why Statistics? 1
1.2 Descriptive Statistics 2
1.3 Inferential Statistics 3
1.4 The Role of Statistics in Educational Research 4
1.5 Variables and Their Measurement 5
1.6 Some Tips on Studying Statistics 8
PART 1 DESCRIPTIVE STATISTICS 13
Chapter 2 Frequency Distributions 14
2.1 Why Organize Data? 14
2.2 Frequency Distributions for Quantitative Variables 14
2.3 Grouped Scores 15
2.4 Some Guidelines for Forming Class Intervals 17
2.5 Constructing a Grouped-Data Frequency Distribution 18
2.6 The Relative Frequency Distribution 19
2.7 Exact Limits 21
2.8 The Cumulative Percentage Frequency Distribution 22
2.9 Percentile Ranks 23
2.10 Frequency Distributions for Qualitative Variables 25
2.11 Summary 26
Chapter 3 Graphic Representation 34
3.1 Why Graph Data? 34
3.2 Graphing Qualitative Data: The Bar Chart 34
3.3 Graphing Quantitative Data: The Histogram 35
3.4 Relative Frequency and Proportional Area 39
3.5 Characteristics of Frequency Distributions 41
3.6 The Box Plot 44
3.7 Summary 45
Chapter 4 Central Tendency 52
4.1 The Concept of Central Tendency 52
4.2 The Mode 52
4.3 The Median 53
4.4 The Arithmetic Mean 54
4.5 Central Tendency and
Distribution Symmetry 57
4.6 Which Measure of Central Tendency to Use? 59
4.7 Summary 59
Chapter 5 Variability 66
5.1 Central Tendency Is Not Enough: The Importance of Variability 66
5.2 The Range 67
5.3 Variability and Deviations From the Mean 68
5.4 The Variance 69
5.5 The Standard Deviation 70
5.6 The Predominance of the Variance and Standard Deviation 71
5.7 The Standard Deviation and the Normal Distribution 72
5.8 Comparing Means of Two Distributions: The Relevance of Variability 73
5.9 In the Denominator: n Versus n .1 75
5.10 Summary 76
Chapter 6 Normal Distributions and Standard Scores 81
6.1 A Little History: Sir Francis Galton and the Normal Curve 81
6.2 Properties of the Normal Curve 82
6.3 More on the Standard Deviation and the Normal Distribution 82
6.4 z Scores 84
6.5 The Normal Curve Table 87
6.6 Finding Area When the Score Is Known 88
6.7 Reversing the Process: Finding Scores When the Area Is Known 91
6.8 Comparing Scores From Different Distributions 93
6.9 Interpreting Effect Size 94
6.10 Percentile Ranks and the Normal Distribution 96
6.11 Other Standard Scores 97
6.12 Standard Scores Do Not "Normalize" a Distribution 98
6.13 The Normal Curve and Probability 98
6.14 Summary 99
Chapter 7 Correlation 106
7.1 The Concept of Association 106
7.2 Bivariate Distributions and Scatterplots 106
7.3 The Covariance 111
7.4 The Pearson r 117
7.5 Computation of r: The Calculating Formula 118
7.6 Correlation and Causation 120
7.7 Factors Influencing Pearson r 122
7.8 Judging the Strength of Association: r 2 125
7.9 Other Correlation Coefficients 127
7.10 Summary 127
Chapter 8 Regression and Prediction 134
8.1 Correlation Versus Prediction 134
8.2 Determining the Line of Best Fit 135
8.3 The Regression Equation in Terms of Raw Scores 138