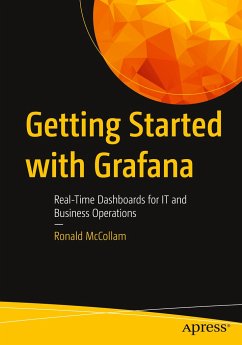
Begin working with the Grafana data visualization platform. This book is a "how-to manual" for deploying and administering Grafana, creating real-time dashboards and alerts, exploring the data you have, and even synthesizing new data by combining and manipulating data from multiple different sources. You'll be able to see and manage data on any scale, from your laptop or a Raspberry Pi to a production datacenter or even a multi-region cloud environment!
Getting Started with Grafana takes a hands-on approach. You'll learn by doing with easy-to-follow examples along with pointers to more resources to help you go deeper. The skills you'll learn will help you provide business value by monitoring your operations in real time and reacting to changing circumstances as they occur. You'll be able to derive new insights from your existing data through Grafana's powerful and beautiful graphing capabilities, and you'll be able to share your dashboards with colleagues soeveryone in your organization can benefit.
What You Will LearnConnect to data "where it lives" and work with multiple sources of dataBuild beautiful and informative dashboards that show real-time statusDeploy Grafana at any scale and manage it efficientlyIntegrate with other enterprise systems such as LDAP or Active DirectoryAutomate creation and deployment of Grafana, dashboards, and alertsUnderstand what is available in the Enterprise version of Grafana
Who This Book Is For
Anyone who has data that they want to understand visually, IT professionals who work with multiple sources of data on a regular basis and need to make sense of the confusion that this data sprawl causes, and people who learn best by doing and want to get hands-on experience quickly with a project and then grow their knowledge


