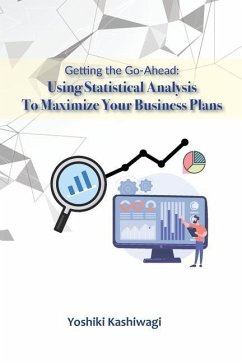
-Using Data in Real LifeAre you drowning in a sea of data? Are you tired of struggling endlessly with numbers, charts and graphs? Do you get lost or fall asleep when you read books on data and statistical analysis? You don't need to be a mathematician to utilize data. Knowing how to apply data is more important than researching complicated analysis techniques. Learn how to set the goal of your analysis and determine what type of data you really need to tell your story more efficiently and effectively.Most books only describe how to analyze data, visualize data or how to make a presentation. This book, however, covers all the steps to take before and after analysis, and any other practical skills you need, such as knowing what type of data to search for, where to find it, and how to share the information to an audience. At the end of the book, the author provides his LinkedIn information for readers to contact him for any further guidance. The author has experience in teaching analysis seminars.-Analysis Tools, Excel Charts and Visualization This book introduces analysis tools to the layman in plain English, such as hypothesis testing, standard deviation, correlation analysis and regression analysis. This information is sufficient enough in applying data analysis to your day-to-day business activities. This book also includes a step-by-step guide of Microsoft Excel to calculate the average, median and standard deviation, to assess risk, to do correlation and regression analyses, and to create charts and graphs. You will be able to visualize data with scatter diagrams, histograms and Pareto charts with Excel, and will only need minimal mathematical knowledge (e.g. the linear function y=mx+b). For the more advanced analyst, the book has a column at the end of each chapter that explains analysis or research techniques in further detail.-Learning Through Relatable ExamplesThis book uses many real life examples in entering in a new market to describe how to assess the market size and target population, set a sales target, choose cost-effective promotional strategies, and estimate profit and risk. The dialogues between a rookie salesperson and his boss make it easy to understand common analysis mistakes and how to avoid them. The author introduces not only the benefits but also the limitations and pitfalls of analysis. For instance, data can be misrepresented with the average and normal distribution. The average is often misused to determine the characteristics of the whole data set (e.g. feeling relieved that your test score is above the class average), even though data distribution may be skewed in reality. The author also explains spurious correlation which may lead you to believe that "successful businessmen wake up early." -Choosing the Right Data and Making an Effective PresentationYou will learn how to collect, select, process, and compare data by converting absolute values into ratio (e.g. per capita), as well as make an effective presentation with visualization and narratives, thus bridging the gap between analysis and presentation. You will be able to break down the analysis results and tell a story, making the information more approachable to the audience so that they can make decisions and take action based on it. The author shows how he changes his presentation style based on his goal and target audience. Furthermore, he provides tips on how to explain why you chose a particular scope of data, and how to look out for misleading or unreliable information when you are an audience of a presentation.
Bitte wählen Sie Ihr Anliegen aus.
Rechnungen
Retourenschein anfordern
Bestellstatus
Storno


