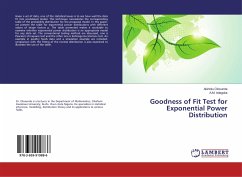
Goodness of Fit Test for Exponential Power Distribution
Versandkostenfrei!
Versandfertig in 6-10 Tagen
24,99 €
inkl. MwSt.

PAYBACK Punkte
12 °P sammeln!
Given a set of data, one of the statistical issues is to see how well the data fit into postulated model. This technique necessitates the corresponding table of the probability distribution for the proposed model. In this paper, we present the table for exponential power distributions with different values of shape factors p. The table presented makes it workable to examine whether exponential power distribution is an appropriate model for any data set. The conventional testing method are discussed, one is Pearson's chi-square test and the other one is Kolmogorov-Smirnov test. An example in po...
Given a set of data, one of the statistical issues is to see how well the data fit into postulated model. This technique necessitates the corresponding table of the probability distribution for the proposed model. In this paper, we present the table for exponential power distributions with different values of shape factors p. The table presented makes it workable to examine whether exponential power distribution is an appropriate model for any data set. The conventional testing method are discussed, one is Pearson's chi-square test and the other one is Kolmogorov-Smirnov test. An example in poultry feeds data and a simulation example are included, comparison with the fitting of the normal distribution is also examined to illustrate the use of the table.


