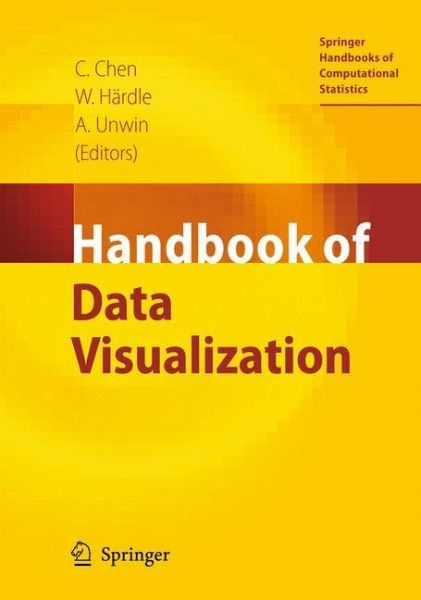
This book gives an overview of modern data visualization methods, both in theory and practice. It details modern graphical tools, graphical methodology for particular areas of statistics, as well software for graphics.
Antony Unwin, Chun-houh Chen, Wolfgang K. Härdle 1. 1 Computational Statistics and Data Visualization . . . . . . . . . . . . . . . . . . . . . . . . . . . 4 Data Visualization and Theory . . . . . . . . . . . . . . . . . . . . . . . . . . . . . . . . . . . . . . . . . . . . . . . . . . . . . . . . . . . . . . . . . 4 Presentation and Exploratory Graphics . . . . . . . . . . . . . . . . . . . . . . . . . . . . . . . . . . . . . . . . . . . . . . . . . . . . 4 Graphics and Computing . . . . . . . . . . . . . . . . . . . . . . . . . . . . . . . . . . . . . . . . . . . . . . . . . . . . . . . . . . . . . . . . . . . . . . . . 5 1. 2 The Chapters . . . . . . . . . . . . . . . . . . . . . . . . . . . . . . . . . . . . . . . . . . . . . . . . . . . . . . . . . . . . . . . . . . . . . . . . . . . . . . . . . . . . . . . 6 Summary and Overview; Part II. . . . . . . . . . . . . . . . . . . . . . . . . . . . . . . . . . . . . . . . . . . . . . . . . . . . . . . . . . . . . . . . 7 Summary and Overview; Part III. . . . . . . . . . . . . . . . . . . . . . . . . . . . . . . . . . . . . . . . . . . . . . . . . . . . . . . . . . . . . . . 9 Summary and Overview; Part IV . . . . . . . . . . . . . . . . . . . . . . . . . . . . . . . . . . . . . . . . . . . . . . . . . . . . . . . . . . . . . . 10 The Authors. . . . . . . . . . . . . . . . . . . . . . . . . . . . . . . . . . . . . . . . . . . . . . . . . . . . . . . . . . . . . . . . . . . . . . . . . . . . . . . . . . . . . . . . . . . . 11 1. 3 Outlook . . . . . . . . . . . . . . . . . . . . . . . . . . . . . . . . . . . . . . . . . . . . . . . . . . . . . . . . . . . . . . . . . . . . . . . . . . . . . . . . . . . . . . . . . . . . . . . . 12 4 Antony Unwin, Chun-houh Chen, Wolfgang K. Härdle Computational Statistics 1. 1 and DataVisualization Tis book is the third volume of the Handbook of Computational Statistics and c- ers the ?eld of data visualization. In line with the companion volumes, it contains a collection ofchapters by experts in the ?eld to present readers with an up-to-date and comprehensive overview of the state of the art. Data visualization is an active area of application and research, and this is a good time to gather together a summary of current knowledge. Graphic displays are ofen very e?ective at communicating information. Tey are also very ofen not e?ective at communicating information. Two important reasons for this state of a?airs are that graphics can be produced with a few clicks of the mouse without any thought and the design of graphics is not taken seriously in many scienti?c textbooks.
Hinweis: Dieser Artikel kann nur an eine deutsche Lieferadresse ausgeliefert werden.
Antony Unwin, Chun-houh Chen, Wolfgang K. Härdle 1. 1 Computational Statistics and Data Visualization . . . . . . . . . . . . . . . . . . . . . . . . . . . 4 Data Visualization and Theory . . . . . . . . . . . . . . . . . . . . . . . . . . . . . . . . . . . . . . . . . . . . . . . . . . . . . . . . . . . . . . . . . 4 Presentation and Exploratory Graphics . . . . . . . . . . . . . . . . . . . . . . . . . . . . . . . . . . . . . . . . . . . . . . . . . . . . 4 Graphics and Computing . . . . . . . . . . . . . . . . . . . . . . . . . . . . . . . . . . . . . . . . . . . . . . . . . . . . . . . . . . . . . . . . . . . . . . . . 5 1. 2 The Chapters . . . . . . . . . . . . . . . . . . . . . . . . . . . . . . . . . . . . . . . . . . . . . . . . . . . . . . . . . . . . . . . . . . . . . . . . . . . . . . . . . . . . . . . 6 Summary and Overview; Part II. . . . . . . . . . . . . . . . . . . . . . . . . . . . . . . . . . . . . . . . . . . . . . . . . . . . . . . . . . . . . . . . 7 Summary and Overview; Part III. . . . . . . . . . . . . . . . . . . . . . . . . . . . . . . . . . . . . . . . . . . . . . . . . . . . . . . . . . . . . . . 9 Summary and Overview; Part IV . . . . . . . . . . . . . . . . . . . . . . . . . . . . . . . . . . . . . . . . . . . . . . . . . . . . . . . . . . . . . . 10 The Authors. . . . . . . . . . . . . . . . . . . . . . . . . . . . . . . . . . . . . . . . . . . . . . . . . . . . . . . . . . . . . . . . . . . . . . . . . . . . . . . . . . . . . . . . . . . . 11 1. 3 Outlook . . . . . . . . . . . . . . . . . . . . . . . . . . . . . . . . . . . . . . . . . . . . . . . . . . . . . . . . . . . . . . . . . . . . . . . . . . . . . . . . . . . . . . . . . . . . . . . . 12 4 Antony Unwin, Chun-houh Chen, Wolfgang K. Härdle Computational Statistics 1. 1 and DataVisualization Tis book is the third volume of the Handbook of Computational Statistics and c- ers the ?eld of data visualization. In line with the companion volumes, it contains a collection ofchapters by experts in the ?eld to present readers with an up-to-date and comprehensive overview of the state of the art. Data visualization is an active area of application and research, and this is a good time to gather together a summary of current knowledge. Graphic displays are ofen very e?ective at communicating information. Tey are also very ofen not e?ective at communicating information. Two important reasons for this state of a?airs are that graphics can be produced with a few clicks of the mouse without any thought and the design of graphics is not taken seriously in many scienti?c textbooks.
Hinweis: Dieser Artikel kann nur an eine deutsche Lieferadresse ausgeliefert werden.
From the reviews:
"This handbook shows hundreds of ways to visualize data by using modern, high-quality statistical graphics. ... It is most enjoyable to see such a large number of specialists sharing their insights of these methods within one volume. This book really feeds the imagination of the reader. High-dimensionally recommended!" (Kimmo Vehkalahti, International Statistical Review, Vol. 76 (3), 2008)