- Gebundenes Buch
- Merkliste
- Auf die Merkliste
- Bewerten Bewerten
- Teilen
- Produkt teilen
- Produkterinnerung
- Produkterinnerung
A Comprehensive Account for Data Analysts of the Methods and Applications of Regression Analysis.
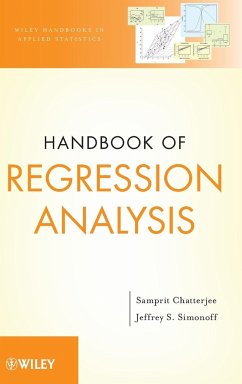
Written by two established experts in the field, the purpose of the Handbook of Regression Analysis is to provide a practical, one-stop reference on regression analysis. The focus is on the tools that both practitioners and researchers use in real life. It is intended to be a comprehensive collection of the theory, methods, and applications of regression methods, but it has been deliberately written at an accessible level.
The handbook provides a quick and convenient reference or "refresher"…mehr
Andere Kunden interessierten sich auch für
![Anova and Ancova Anova and Ancova]() Andrew RutherfordAnova and Ancova125,99 €
Andrew RutherfordAnova and Ancova125,99 €![Linear Regression Analysis Linear Regression Analysis]() George A. F. SeberLinear Regression Analysis188,99 €
George A. F. SeberLinear Regression Analysis188,99 €![Statistical Inference for Models with Multivariate t-Distributed Errors Statistical Inference for Models with Multivariate t-Distributed Errors]() A. K. Md. Ehsanes SalehStatistical Inference for Models with Multivariate t-Distributed Errors117,99 €
A. K. Md. Ehsanes SalehStatistical Inference for Models with Multivariate t-Distributed Errors117,99 €![MCM Handbook MCM Handbook]() Dirk P. KroeseMCM Handbook170,99 €
Dirk P. KroeseMCM Handbook170,99 €![Simplicity, Complexity and Modelling Simplicity, Complexity and Modelling]() Simplicity, Complexity and Modelling110,99 €
Simplicity, Complexity and Modelling110,99 €![Latent Variable Models and Factor 3e Latent Variable Models and Factor 3e]() David J. BartholomewLatent Variable Models and Factor 3e94,99 €
David J. BartholomewLatent Variable Models and Factor 3e94,99 €![Linear Models 2E Linear Models 2E]() Alvin C. RencherLinear Models 2E179,99 €
Alvin C. RencherLinear Models 2E179,99 €-
-
-
A Comprehensive Account for Data Analysts of the Methods and Applications of Regression Analysis.
Written by two established experts in the field, the purpose of the Handbook of Regression Analysis is to provide a practical, one-stop reference on regression analysis. The focus is on the tools that both practitioners and researchers use in real life. It is intended to be a comprehensive collection of the theory, methods, and applications of regression methods, but it has been deliberately written at an accessible level.
The handbook provides a quick and convenient reference or "refresher" on ideas and methods that are useful for the effective analysis of data and its resulting interpretations. Students can use the book as an introduction to and/or summary of key concepts in regression and related course work (including linear, binary logistic, multinomial logistic, count, and nonlinear regression models). Theory underlying the methodology is presented when it advances conceptual understanding and is always supplemented by hands-on examples.
References are supplied for readers wanting more detailed material on the topics discussed in the book. R code and data for all of the analyses described in the book are available via an author-maintained website.
Produktdetails
- Produktdetails
- Wiley Handbooks in Applied Statistics .
- Verlag: Wiley & Sons
- 1. Auflage
- Seitenzahl: 252
- Erscheinungstermin: 26. Dezember 2012
- Englisch
- Abmessung: 240mm x 161mm x 18mm
- Gewicht: 468g
- ISBN-13: 9780470887165
- ISBN-10: 0470887168
- Artikelnr.: 36540058
- Herstellerkennzeichnung
- Libri GmbH
- Europaallee 1
- 36244 Bad Hersfeld
- gpsr@libri.de
SAMPRIT CHATTERJEE, PhD, is Professor Emeritus of Statistics at New York University. A Fellow of the American Statistical Association, Dr. Chatterjee has been a Fulbright scholar in both Kazakhstan and Mongolia. He is the coauthor of Regression Analysis by Example, Sensitivity Analysis in Linear Regression, and A Casebook for a First Course in Statistics and Data Analysis, all published by Wiley. Jeffrey S. Simonoff, PhD, is Professor of Statistics at the Leonard N. Stern School of Business of New York University. He is a Fellow of the American Statistical Association, a Fellow of the Institute of Mathematical Statistics, and an Elected Member of the International Statistical Institute. He has authored or coauthored more than ninety articles and five books on the theory and applications of statistics.
Preface xi
Part I The Multiple Linear Regression Model
1 Multiple Linear Regression 3
1.1 Introduction 3
1.2 Concepts and Background Material 4
1.2.1 The Linear Regression Model 4
1.2.2 Estimation Using Least Squares 5
1.2.3 Assumptions 8
1.3 Methodology 9
1.3.1 Interpreting Regression Coefficients 9
1.3.2 Measuring the Strength of the Regression Relationship 10
1.3.3 Hypothesis Tests and Confidence Intervals for _ 12
1.3.4 Fitted Values and Predictions 13
1.3.5 Checking Assumptions Using Residual Plots 14
1.4 Example - Estimating Home Prices 16
1.5 Summary 19
2 Model Building 23
2.1 Introduction 23
2.2 Concepts and Background Material 24
2.2.1 Using hypothesis tests to compare models 24
2.2.2 Collinearity 26
2.3 Methodology 29
2.3.1 Model Selection 29
2.3.2 Example-Estimating Home Prices (continued) 31
2.4 Indicator Variables and Modeling Interactions 38
2.4.1 Example-Electronic Voting and the 2004 Presidential Election 40
2.5 Summary 46
Part II Addressing Violations of Assumptions
3 Diagnostics for Unusual Observations 53
3.1 Introduction 53
3.2 Concepts and Background Material 54
3.3 Methodology 56
3.3.1 Residuals and Outliers 56
3.3.2 Leverage Points 57
3.3.3 Influential Points and Cook's Distance 58
3.4 Example - Estimating Home Prices (continued) 60
3.5 Summary 64
4 Transformations and Linearizable Models 67
4.1 Introduction 67
4.2 Concepts and Background Material: the Log-Log Model 69
4.3 Concepts and Background Material: Semilog models 69
4.3.1 Logged response variable 70
4.3.2 Logged predictor variable 70
4.4 Example - Predicting Movie Grosses After One Week 71
4.5 Summary 78
5 Time Series Data and Autocorrelation 81
5.1 Introduction 81
5.2 Concepts and Background Material 83
5.3 Methodology: Identifying Autocorrelation 85
5.3.1 The Durbin-Watson Statistic 86
5.3.2 The Autocorrelation Function (ACF) 87
5.3.3 Residual Plots and the Runs Test 87
5.4 Methodology: Addressing Autocorrelation 88
5.4.1 Detrending and Deseasonalizing 88
5.4.2 Example - e-Commerce Retail Sales 89
5.4.3 Lagging and Differencing 96
5.4.4 Example - Stock Indexes 96
5.4.5 Generalized Least Squares (GLS): the Cochrane-Orcutt Procedure 101
5.4.6 Example - Time Intervals Between Old Faithful Eruptions 104
5.5 Summary 107
Part III Categorical Predictors
6 Analysis of Variance 113
6.1 Introduction 113
6.2 Concepts and Background Material 114
6.2.1 One-way ANOVA 114
6.2.2 Two-way ANOVA 115
6.3 Methodology 117
6.3.1 Codings for categorical predictors 117
6.3.2 Multiple comparisons 122
6.3.3 Levene's test and weighted least squares 124
6.3.4 Membership in multiple groups 127
6.4 Example - DVD Sales of Movies 129
6.5 Higher-Way ANOVA 134
6.6 Summary 136
7 Analysis of Covariance 139
7.1 Introduction 139
7.2 Methodology 139
7.2.1 Constant shift models 139
7.2.2 Varying slope models 141
7.3 Example - International Grosses of Movies 141
7.4 Summary 145
Part IV Other Regression Models
8 Logistic Regression 149
8.1 Introduction 149
8.2 Concepts and Background Material 151
8.2.1 The logit response function 151
8.2.2 Bernoulli and binomial random variables 152
8.2.3 Prospective and retrospective designs 153
8.3 Methodology 156
8.3.1 Maximum likelihood estimation 156
8.3.2 Inference, model comparison, and model selection 157
8.3.3 Goodness-of-Fit 159
8.3.4 Measures of association and classification accuracy 161
8.3.5 Diagnostics 163
8.4 Example - Smoking and Mortality 163
8.5 Example - Modeling Bankruptcy 167
8.6 Summary 173
9 Multinomial Regression 177
9.1 Introduction 177
9.2 Concepts and Background Material 178
9.2.1 Nominal Response Variable 178
9.2.2 Ordinal Response Variable 180
9.3 Methodology 182
9.3.1 Estimation 182
9.3.2 Inference, model comparisons, and strength of fit 183
9.3.3 Lack of fit and violations of assumptions 184
9.4 Example - City Bond Ratings 185
9.5 Summary 189
10 Count Regression 191
10.1 Introduction 191
10.2 Concepts and Background Material 192
10.2.1 The Poisson random variable 192
10.2.2 Generalized linear models 193
10.3 Methodology 194
10.3.1 Estimation and inference 194
10.3.2 Offsets 195
10.4 Overdispersion and Negative Binomial Regression 196
10.4.1 Quasi-likelihood 196
10.4.2 Negative Binomial Regression 197
10.5 Example - Unprovoked Shark Attacks in Florida 198
10.6 Other Count Regression Models 206
10.7 Poisson Regression and Weighted Least Squares 208
10.7.1 Example - International Grosses of Movies (continued) 209
10.8 Summary 211
11 Nonlinear Regression 215
11.1 Introduction 215
11.2 Concepts and Background Material 216
11.3 Methodology 218
11.3.1 Nonlinear least squares estimation 218
11.3.2 Inference for nonlinear regression models 219
11.4 Example - Michaelis-Menten Enzyme Kinetics 220
11.5 Summary 225
Bibliography 227
Index 231

