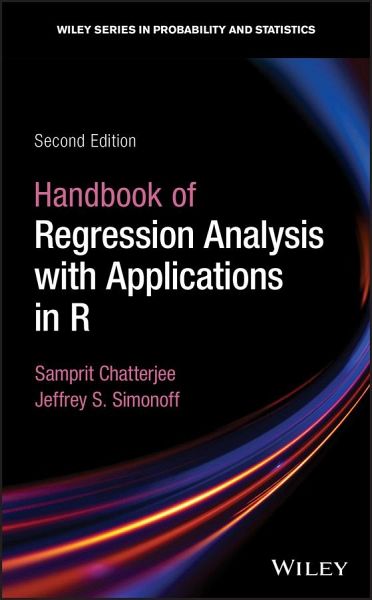
Handbook of Regression Analysis with Applications in R
Versandkostenfrei!
Versandfertig in 2-4 Wochen
142,99 €
inkl. MwSt.
Weitere Ausgaben:

PAYBACK Punkte
71 °P sammeln!
Handbook and reference guide for students and practitioners of statistical regression-based analyses in RHandbook of Regression Analysis with Applications in R, Second Edition is a comprehensive and up-to-date guide to conducting complex regressions in the R statistical programming language. The authors' thorough treatment of "classical" regression analysis in the first edition is complemented here by their discussion of more advanced topics including time-to-event survival data and longitudinal and clustered data.The book further pays particular attention to methods that have become prominent...
Handbook and reference guide for students and practitioners of statistical regression-based analyses in R
Handbook of Regression Analysis with Applications in R, Second Edition is a comprehensive and up-to-date guide to conducting complex regressions in the R statistical programming language. The authors' thorough treatment of "classical" regression analysis in the first edition is complemented here by their discussion of more advanced topics including time-to-event survival data and longitudinal and clustered data.
The book further pays particular attention to methods that have become prominent in the last few decades as increasingly large data sets have made new techniques and applications possible. These include:
_ Regularization methods
_ Smoothing methods
_ Tree-based methods
In the new edition of the Handbook, the data analyst's toolkit is explored and expanded. Examples are drawn from a wide variety of real-life applications and data sets. All the utilized R code and data are available via an author-maintained website.
Of interest to undergraduate and graduate students taking courses in statistics and regression, the Handbook of Regression Analysis will also be invaluable to practicing data scientists and statisticians.
Dieser Artikel kann nur an eine deutsche Lieferadresse ausgeliefert werden.


