John Essick (Professor of Physics, Professor of Physics, Reed Colle
Hands-On Introduction to LabVIEW for Scientists and Engineers
Schade – dieser Artikel ist leider ausverkauft. Sobald wir wissen, ob und wann der Artikel wieder verfügbar ist, informieren wir Sie an dieser Stelle.
John Essick (Professor of Physics, Professor of Physics, Reed Colle
Hands-On Introduction to LabVIEW for Scientists and Engineers
- Broschiertes Buch
- Merkliste
- Auf die Merkliste
- Bewerten Bewerten
- Teilen
- Produkt teilen
- Produkterinnerung
- Produkterinnerung
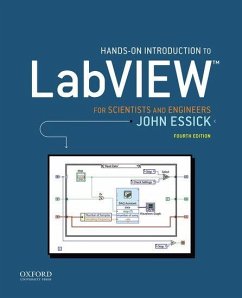
Departing from the style of typical manuals, Hands-On Introduction to LabVIEW for Scientists and Engineers, Fourth Edition, uses a learn-by-doing approach to guide students through using this powerful laboratory tool. It helps students--who are not assumed to have prior experience--master the computer-based skills they need to carry out effective experiments.
Andere Kunden interessierten sich auch für
![An Introduction to Python Programming for Scientists and Engineers An Introduction to Python Programming for Scientists and Engineers]() Johnny Wei-Bing LinAn Introduction to Python Programming for Scientists and Engineers54,99 €
Johnny Wei-Bing LinAn Introduction to Python Programming for Scientists and Engineers54,99 €![Introduction to Probability and Statistics for Engineers and Scientists Introduction to Probability and Statistics for Engineers and Scientists]() Sheldon M. Ross (Department of Industrial Professor and Systems EnIntroduction to Probability and Statistics for Engineers and Scientists132,99 €
Sheldon M. Ross (Department of Industrial Professor and Systems EnIntroduction to Probability and Statistics for Engineers and Scientists132,99 €![Introduction to LabVIEW FPGA for RF, Radar, and Electronic Warfare Applications Introduction to LabVIEW FPGA for RF, Radar, and Electronic Warfare Applications]() Terry StratoudakisIntroduction to LabVIEW FPGA for RF, Radar, and Electronic Warfare Applications142,99 €
Terry StratoudakisIntroduction to LabVIEW FPGA for RF, Radar, and Electronic Warfare Applications142,99 €![Partial Differential Equations for Scientists and Engineers Partial Differential Equations for Scientists and Engineers]() Stanley J. FarlowPartial Differential Equations for Scientists and Engineers23,99 €
Stanley J. FarlowPartial Differential Equations for Scientists and Engineers23,99 €![Handbook of Exact Solutions to Mathematical Equations Handbook of Exact Solutions to Mathematical Equations]() Andrei D. PolyaninHandbook of Exact Solutions to Mathematical Equations127,99 €
Andrei D. PolyaninHandbook of Exact Solutions to Mathematical Equations127,99 €![Advanced Mathematics for Engineers and Scientists with Worked Examples Advanced Mathematics for Engineers and Scientists with Worked Examples]() Shefiu Zakariyah (UK University of Derby)Advanced Mathematics for Engineers and Scientists with Worked Examples66,99 €
Shefiu Zakariyah (UK University of Derby)Advanced Mathematics for Engineers and Scientists with Worked Examples66,99 €![Introduction to High Performance Computing for Scientists and Engineers Introduction to High Performance Computing for Scientists and Engineers]() Georg HagerIntroduction to High Performance Computing for Scientists and Engineers96,99 €
Georg HagerIntroduction to High Performance Computing for Scientists and Engineers96,99 €-
-
-
Departing from the style of typical manuals, Hands-On Introduction to LabVIEW for Scientists and Engineers, Fourth Edition, uses a learn-by-doing approach to guide students through using this powerful laboratory tool. It helps students--who are not assumed to have prior experience--master the computer-based skills they need to carry out effective experiments.
Produktdetails
- Produktdetails
- Verlag: Oxford University Press Inc
- 4 Revised edition
- Seitenzahl: 720
- Erscheinungstermin: 12. Juli 2018
- Englisch
- Abmessung: 236mm x 189mm x 30mm
- Gewicht: 1118g
- ISBN-13: 9780190853068
- ISBN-10: 0190853069
- Artikelnr.: 51971401
- Herstellerkennzeichnung
- Libri GmbH
- Europaallee 1
- 36244 Bad Hersfeld
- gpsr@libri.de
John Essick is professor of Physics at Reed College. His research interests focus on the optoelectronic properties of semiconductors. Since 1993, Dr. Essick has taught computer-based experimentation using LabVIEW as part of Reed's junior-level Advanced Laboratory and used LabVIEW to carry out many research projects.
* Preface
* About the Author
* 1. LABVIEW PROGRAM DEVELOPMENT
* 1.1 LabVIEW Programming Environment
* 1.2 Blank VI
* 1.3 Front-Panel Editing
* 1.4 Block-Diagram Editing
* 1.5 Program Execution
* 1.6 Pop-Up Menu and Data-Type Representation
* 1.7 Program Storage
* 1.8 Quick Drop
* 2. THE WHILE LOOP AND WAVEFORM CHART
* 2.1 Programming Structures and Graphing Modes
* 2.2 While Loop Basics
* 2.3 Sine-Wave Plot Using a While Loop and Waveform Chart
* 2.4 LabVIEW Help Window
* 2.5 Front Panel Editing
* 2.6 Waveform Chart Pop-Up Menu
* 2.7 Finishing the Program
* 2.8 Program Execution
* 2.9 Program Improvements
* 2.10 Data Types and Automatic Creation Feature
* 3. THE FOR LOOP AND WAVEFORM GRAPH
* 3.1 For Loop Basics
* 3.2 Sine-Wave Plot Using a For Loop and Waveform Graph
* 3.3 Waveform Graph
* 3.4 Owned and Free Labels
* 3.5 Creation of Sine Wave Using a For Loop
* 3.6 Cloning Block-Diagram Icons
* 3.7 Auto-Indexing Feature
* 3.8 Running the VI
* 3.9 X-Axis Calibration of the Waveform Graph
* 3.10 Sine-Wave Plot Using a While Loop and Waveform Graph
* 3.11 Front-Panel Array Indicator
* 3.12 Debugging With the Probe Watch Window and Error List
* 4. THE MATHSCRIPT NODE AND XY GRAPH
* 4.1 MathScript Node Basics
* 4.2 Quick MathScript Node Example: Sine-Wave Plot
* 4.3 Waveform Simulator Using a MathScript Node and XY Graph
* 4.4 Creating an XY Cluster
* 4.5 Running the VI
* 4.6 LabVIEW MathScript Window
* 4.7 Adding Shape Options Using an Enumerated Type Control
* 4.8 Finishing the Block Diagram
* 4.9 Running the VI
* 4.10 Control and Indicator Clusters
* 4.11 Creating an Icon Using the Icon Editor
* 4.12 Icon Design
* 4.13 Connector Assignment
* 5. INTRODUCTION TO DATA ACQUISITION DEVICES USING MAX
* 5.1 Data Acquisition Hardware
* 5.2 Measurement and Automation Explorer (MAX)
* 5.3 Analog Input Modes
* 5.4 Range and Resolution
* 5.5 Sampling Frequency and the Aliasing Effect
* 5.6 Analog Input Operation Using MAX
* 5.7 Analog Output
* 5.8 Analog Output Operation Using MAX
* 5.9 Digital Input/Output
* 5.10 Digital Input/Output Operation Using Max
* 6. DATA ACUISITION USING DAQ ASSISTANT
* 6.1 Data Acquisition VIs
* 6.2 Simple Analog Input Operation on a DC Voltage
* 6.3 Digital Oscilloscope
* 6.4 DC Voltage Storage
* 6.5 Hardware-Timed Waveform Generator
* 6.6 Placing a Custom-Made VI on a Block Diagram
* 6.7 Completing and Executing Waveform Generator (Express)
* 7. DATA FILES AND CHARACTER STRINGS
* 7.1 ASCII Text and Binary Data Files
* 7.2 Storing Data in Spreadsheet-Formatted File
* 7.3 Storing a One-Dimensional Data Array
* 7.4 Transpose Option
* 7.5 Storing a Two-Dimensional Data Array
* 7.6 Controlling the Format of Stored Data
* 7.7 The Path Constant and Platform Portability
* 7.8 Fundamental File I/O VIs
* 7.9 Adding Text Labels to a Spreadsheet File
* 7.10 Backslash Codes
* 8. SHIFT REGISTERS
* 8.1 Shift Register Basics
* 8.2 Quick Shift Register Example: Integer Sum
* 8.3 Noise and Signal Averaging
* 8.4 Noisy Sine VI
* 8.5 Moving Average of Four Traces
* 8.6 Modularity and Automatic SubVI Creation
* 8.7 Moving Average of Arbitrary Number of Traces
* 9. THE CASE STRUCTURE
* 9.1 Case Structure Basics
* 9.2 Quick Case Structure Example: Runtime Options Using Property
Nodes
* 9.3 State Machine Architecture: Guessing Game
* 9.4 State Machine Architecture: Express VI-Based Digital Oscilloscope
* 10. DATA DEPENDENCY AND THE SEQUENCE STRUCTURE
* 10.1 Data Dependency and Sequence Structure Basics
* 10.2 Event Timer Using a Sequence Structure
* 10.3 Event Timer Using Data Dependency
* 10.4 Highlight Execution
* 11. ANALYSIS VIs: CURVE FITTING
* 11.1 Thermistor Resistance-Temperature Data File
* 11.2 Temperature Measurement Using Thermistors
* 11.3 The Linear Least-Squares Method
* 11.4 Inputting Data to a VI Using a Front-Panel Array Control
* 11.5 Inputting Data to a VI by Reading from a Disk File
* 11.6 Slicing Up a Multi-Dimensional Array
* 11.7 Running the VI
* 11.8 Curve Fitting Using the Linear Least-Squares Method
* 11.9 Residual Plot
* 11.10 Curve Fitting Using the Nonlinear Least-Squares Method
* 12. ANALYSIS VIs: FAST FOURIER TRANSFORM
* 12.1 Quick Fast Fourier Transform Example
* 12.2 The Fourier Transform
* 12.3 Discrete Sampling and the Nyquist Frequency
* 12.4 The Discrete Fourier Transform
* 12.5 The Fast Fourier Transform
* 12.6 Frequency Calculator VI
* 12.7 FFT of Sinusoids
* 12.8 Applying the FFT to Various Sinusoidal Inputs
* 12.9 Magnitude of Complex-Amplitude
* 12.10 Observing Leakage
* 12.11 Windowing
* 12.12 Estimating Frequency and Amplitude
* 12.13 Aliasing
* 13. DATA ACQUISITION AND GENERATION USING DAQMX VIs
* 13.1 DAQmx VI Basics
* 13.2 Simple Analog Input Operation on a DC Voltage
* 13.3 Digital Oscilloscope
* 13.4 Express VI Automatic Code Generation
* 13.5 Limitations of Express VIs
* 13.6 Improving Digital Oscilloscope Using State Machine Architecture
* 13.7 Analog Output Operations
* 13.8 Waveform Generator
* 14. CONTROL OF STAND-ALONE INSTRUMENTS
* 14.1 Instrument Control using VISA VIs
* 14.2 The VISA Session
* 14.3 The IEEE 488.2 Standard
* 14.4 Common Commands
* 14.5 Status Reporting
* 14.6 Device-Specific Commands
* 14.7 Specific Hardware Used In This Chapter
* 14.8 Measurement and Automation Explorer (MAX)
* 14.9 Simple VISA-Based Query Operation
* 14.10 Message Termination
* 14.11 Getting and Setting Communication Properties Using a Property
Node
* 14.12 Performing a Measurement over the Interface Bus
* 14.13 Synchronization Methods
* 14.14 Measurement VI Based on the Serial Poll Method
* 14.15 Measurement VI Based on the Service Request Method
* 14.16 Creating an Instrument Driver
* 14.17 Using the Instrument Driver to Write an Application Program
* APPENDIX A. FORMULA NODE PROGRAMMING FOR CHAPTER 4
* A.1 Formula Node Basics
* A.2 Quick Formula Node Example: Sine-Wave Plot (Section 4.2)
* A.3 Formula Node-Based Waveform Simulator (Sections 4.3-4.4)
* A.4 Formula Node-Based Waveform Simulator (Section 4.8)
* A.5 Formula Node-Based Waveform Simulator (Section 4.10)
* APPENDIX B. MATHEMATICS OF LEAKAGE AND WINDOWING
* B.1 Analytic Description of Leakage
* B.2 Description of Leakage Using the Convolution Theorem
* APPENDIX C. PID TEMPERATURE CONTROL PROJECT
* C.1 Project Description
* C.2 Voltage-Controlled Bidirectional Current Driver for
Thermoelectric Device
* C.3 PID Temperature Control Algorithm
* C.4 PID Temperature Control System
* C.5 Construction of Temperature Control System
* Index

