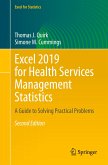
Your all-in-one resource for quantitative, qualitative, and spatial analyses in Excel® using current real-world healthcare datasets. Health Services Research and Analytics Using Excel® is a practical resource for graduate and advanced undergraduate students in programs studying healthcare administration, public health, and social work as well as public health workers and healthcare managers entering or working in the field. This book provides one integrated, application-oriented resource for common quantitative, qualitative, and spatial analyses using only Excel. With an easy-to-follow presentation of qualitative and quantitative data, students can foster a balanced decision-making approach to financial data, patient statistical data and utilization information, population health data, and quality metrics while cultivating analytical skills that are necessary in a data-driven healthcare world. Whereas Excel is typically considered limited to quantitative application, this book expands into other Excel applications based on spatial analysis and data visualization represented through 3D Maps as well as text analysis using the free add-in in Excel. Chapters cover the important methods and statistical analysis tools that a practitioner will face when navigating and analyzing data in the public domain or from internal data collection at their health services organization. Topics covered include importing and working with data in Excel; identifying, categorizing, and presenting data; setting bounds and hypothesis testing; testing the mean; checking for patterns; data visualization and spatial analysis; interpreting variance; text analysis; and much more. A concise overview of research design also provides helpful background on how to gather and measure useful data prior to analyzing in Excel. Because Excel is the most common data analysis software used in the workplace setting, all case examples, exercises, and tutorials are provided with the latest updates to the Excel software from Office365 ProPlus® and newer versions, including all important "Add-ins" such as 3D Maps, MeaningCloud, and Power Pivots, among others. With numerous practice problems and over 100 step-by-step videos, Health Services Research and Analytics Using Excel® is an extremely practical tool for students and health service professionals who must know how to work with data, how to analyze it, and how to use it to improve outcomes unique to healthcare settings.Key Features:Provides a competency-based analytical approach to health services research using Excel Includes applications of spatial analysis and data visualization tools based on 3D Maps in Excel Lists select sources of useful national healthcare data with descriptions and website information Chapters contain case examples and practice problems unique to health services All figures and videos are applicable to Office365 ProPlus Excel and newer versions Contains over 100 step-by-step videos of Excel applications covered in the chapters and provides concise video tutorials demonstrating solutions to all end-of-chapter practice problems Robust Instructor ancillary package that includes Instructor's Manual, PowerPoints, and Test Bank
Hinweis: Dieser Artikel kann nur an eine deutsche Lieferadresse ausgeliefert werden.
Hinweis: Dieser Artikel kann nur an eine deutsche Lieferadresse ausgeliefert werden.


