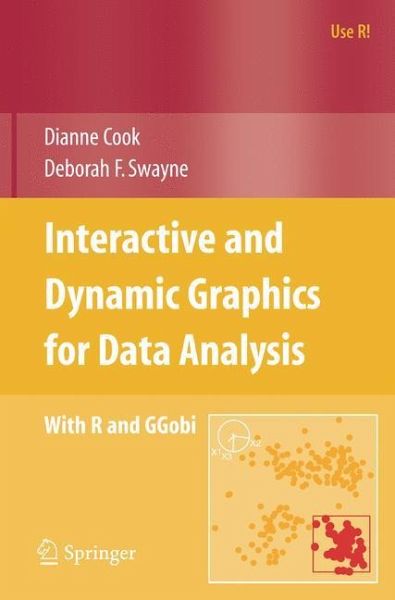
This book is about using interactive and dynamic plots on a computer screen as part of data exploration and modeling, both alone and as a partner with static graphics and non-graphical computational methods. The area of int- active and dynamic data visualization emerged within statistics as part of research on exploratory data analysis in the late 1960s, and it remains an active subject of research today, as its use in practice continues to grow. It now makes substantial contributions within computer science as well, as part of the growing ?elds of information visualization and data mining, especially visual data mining. The material in this book includes: - An introduction to data visualization, explaining how it di?ers from other types of visualization. - Adescriptionofourtoolboxofinteractiveanddynamicgraphicalmethods. - An approach for exploring missing values in data. - An explanation of the use of these tools in cluster analysis and supervised classi?cation. - An overview ofadditional material available on the web. - A description of the data used in the analyses and exercises. The book's examples use the software R and GGobi. R (Ihaka & Gent- man 1996, RDevelopment CoreTeam2006) isafreesoftware environment for statistical computing and graphics; it is most often used from the command line, provides a wide variety of statistical methods, and includes high-quality staticgraphics.RaroseintheStatisticsDepartmentoftheUniversityofAu- land and is now developed and maintained by a global collaborative e?ort.
Hinweis: Dieser Artikel kann nur an eine deutsche Lieferadresse ausgeliefert werden.
From the reviews:
"The central theme of the book is multivariate data visualization. The focus is on interactive and dynamic graphics.... The target audience of the book is (advanced) undergraduate and graduate students, but also industrial statisticians, engineers, bioinformaticists, and computer scientists.... Each chapter ends with some exercises. The chapters are well written and structured, and the examples are well documented.... A reader with a decent knowledge of multivariate statistics ... will be happy with this book." (Ruud H. Koning, Kwantitatieve Methoden, 2008R14)
"In this book, R commands are used to exploit the power of the GGobi systems for interactive and dynamic graphics....This book, ... is a very useful brief overview of the insight that a powerful modern suite of graphics tools may offer." (John Maindonald, International Statistical Review, 2008, 76, 3, pages 436-437)
"Diane Cook and Deborah Swayne's new book, part of Springer's Use R! series, helps fill an important niche in the literature for the R community and readers of Biometrics. The title of the book indicates the substantial challenge: the book is neither purely methodological nor simply about software. It draws upon the expertise of a wide range of contributors.... I will borrow a phrase the authors use on the opening page: these resources help us "orient ourselves in the sea of information."" (Biometrics 2008)
"The book describes the use of interactive and dynamic graphics as part of multidimensional data analysis. ... The book may be used as a text in a class on statistical graphics, exploratory data analysis, visual data mining, or information visualisation. It might also be used as an adjunct text in a course on multivariate data analysis or data mining. Moreover, the book is suitable for an industrial statistician, engineer, bioinformaticist, or computer scientist ... . Finally, it may be useful to amathematician ... ." (Christina Diakaki, Zentralblatt MATH, Vol. 1154, 2009)