88,99 €
inkl. MwSt.
Versandkostenfrei*
Versandfertig in über 4 Wochen
Melden Sie sich für den Produktalarm an, um über die Verfügbarkeit des Produkts informiert zu werden.

  • Broschiertes Buch

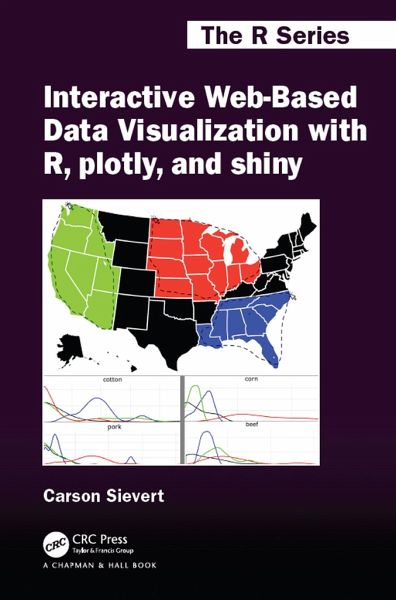
This book describes interactive data visualization using the R package plotly. It focuses on tools and techniques that data analysts should find useful for asking follow-up questions from their data using interactive web graphics. A basic understanding of R is assumed.

Produktbeschreibung
This book describes interactive data visualization using the R package plotly. It focuses on tools and techniques that data analysts should find useful for asking follow-up questions from their data using interactive web graphics. A basic understanding of R is assumed.
Autorenporträt
Carson Sievert is the author and maintainer of the plotly R package, a recipient of the American Statistical Association's 2017 John Chambers award, and Program Chair of the Section on Statistical Graphics. After receiving a PhD in statistics from Iowa State, Carson joined RStudio as a software engineer to work on software that bridges R and web technologies such as shiny, plotly, and rmarkdown.