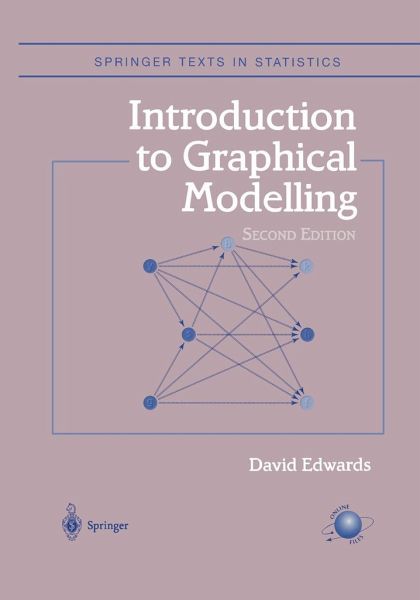
Introduction to Graphical Modelling
Versandkostenfrei!
Versandfertig in 6-10 Tagen
91,99 €
inkl. MwSt.
Weitere Ausgaben:

PAYBACK Punkte
46 °P sammeln!
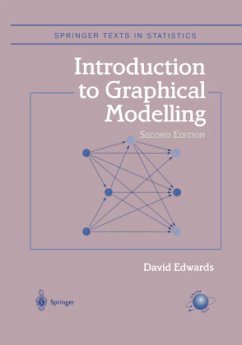
Graphic modelling is a form of multivariate analysis that uses graphs to represent models. These graphs display the structure of dependencies, both associational and causal, between the variables in the model. This textbook provides an introduction to graphical modelling with emphasis on applications and practicalities rather than on a formal development. It is based on the popular software package for graphical modelling, MIM, a freeware version of which can be downloaded from the Internet. Following an introductory chapter which sets the scene and describes some of the basic ideas of graphic...
Graphic modelling is a form of multivariate analysis that uses graphs to represent models. These graphs display the structure of dependencies, both associational and causal, between the variables in the model. This textbook provides an introduction to graphical modelling with emphasis on applications and practicalities rather than on a formal development. It is based on the popular software package for graphical modelling, MIM, a freeware version of which can be downloaded from the Internet. Following an introductory chapter which sets the scene and describes some of the basic ideas of graphical modelling, subsequent chapters describe particular families of models, including log-linear models, Gaussian models, and models for mixed discrete and continuous variables. Further chapters cover hypothesis testing and model selection. Chapters 7 and 8 are new to the second edition. Chapter 7 describes the use of directed graphs, chain graphs, and other graphs. Chapter 8 summarizes some recent work on causal inference, relevant when graphical models are given a causal interpretation. This book will provide a useful introduction to this topic for students and researchers.


