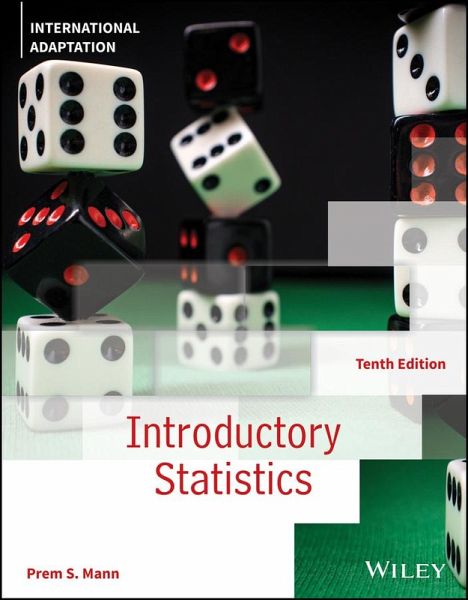
Prem S. Mann (Eastern Connecticut State University)
Introductory Statistics, International Adaptation
Prem S. Mann (Eastern Connecticut State University)
Introductory Statistics, International Adaptation
- Broschiertes Buch
- Merkliste
- Auf die Merkliste
- Bewerten Bewerten
- Teilen
- Produkt teilen
- Produkterinnerung
- Produkterinnerung
Introductory Statistics, 10th edition, is written for a one- or two-semester first course in applied statistics and is intended for students who do not have a strong background in mathematics. The only prerequisite is knowledge of elementary algebra. Known for its realistic examples and exercises, clarity and brevity of presentation, and soundness of pedagogical approach, the book encourages statistical interpretation and literacy regardless of student background. The book employs a clear and straightforward writing style and uses abundant visuals and figures, which reinforce key concepts and…mehr
Andere Kunden interessierten sich auch für
- Neil WeissIntroductory Statistics, MyLab Revision, Global Edition104,99 €
- Alan Stuart (University of London Emeritus)Kendall's Advanced Theory of Statistics, Set677,99 €
- Charles Henry Brase (.)Understanding Basic Statistics, International Metric Edition96,99 €
- Prem S. Mann (Eastern Connecticut State University)Mann's Introductory Statistics64,99 €
- Magno UrbanoIntroductory Electrical Engineering With Math Explained in Accessible Language105,99 €
- Zeljko IvezicStatistics, Data Mining, and Machine Learning in Astronomy90,99 €
- Jack W. PlunkettPlunkett's Engineering & Research Industry Almanac 2023: Engineering & Research Industry Market Research, Statistics, Trends and Leading Companies466,99 €
-
-
-
Introductory Statistics, 10th edition, is written for a one- or two-semester first course in applied statistics and is intended for students who do not have a strong background in mathematics. The only prerequisite is knowledge of elementary algebra. Known for its realistic examples and exercises, clarity and brevity of presentation, and soundness of pedagogical approach, the book encourages statistical interpretation and literacy regardless of student background. The book employs a clear and straightforward writing style and uses abundant visuals and figures, which reinforce key concepts and relate new ideas to prior sections for a smooth transition between topics. This international edition offers new and updated materials and focuses on strengthening the coverage by including new sections on types of scales, negative binomial distribution, and two-way analysis of variance. Additionally, discussions on ogive curves, geometric mean, and harmonic mean have also been added. Many examples and exercises throughout the book are new or revised, providing varied ways for students to practice statistical concepts.
Hinweis: Dieser Artikel kann nur an eine deutsche Lieferadresse ausgeliefert werden.
Produktdetails
- Produktdetails
- Verlag: John Wiley & Sons Inc
- 10 ed
- Seitenzahl: 752
- Erscheinungstermin: 6. Februar 2024
- Englisch
- Abmessung: 219mm x 282mm x 38mm
- Gewicht: 1656g
- ISBN-13: 9781394226382
- ISBN-10: 1394226381
- Artikelnr.: 69192057
- Herstellerkennzeichnung
- Libri GmbH
- Europaallee 1
- 36244 Bad Hersfeld
- 06621 890
PREM S. MANN has a Bachelor's degree in mathematics, economics, and English, and a Master's degree in economics, with a specialization in statistics, from Punjab University, India. Prem taught economics and statistics at a Punjab University college for four years. In 1975 he left India for the United Kingdom, where he studied at the University of Manchester and received his second Master's degree in economics. Then he attended the London School of Economics where he studied operations research. In January 1980, Prem moved to Los Angeles, California, to study for his Ph.D. in Economics at UCLA. One of his fields of specialization in his Ph.D. studies was statistics and quantitative methods. While working on his Ph.D. at UCLA, Prem Mann taught statistics and quantitative methods at the Los Angeles and Fullerton campuses of California State University, first as an adjunct instructor and then as a full-time faculty member. In 1986, he joined Eastern Connecticut State University as a faculty member, where he taught statistics, mathematics for economics, and econometrics for 29 years. He also served as chair of the Department of Economics at Eastern Connecticut State University for 20 years before retiring in 2015. Currently, Prem Mann lives with his wife and close to his children and grandchildren in New York City. In addition to Introductory Statistics, which is currently in its 10th edition, Prem Mann has authored Introductory Statistics Using Technology and Statistics for Business and Economics. He has also coauthored Practitioner's Guide to Statistics and Lean Six Sigma for Process Improvements with Mikel J. Harry, Ofelia C. De Hodgins, Richard L. Hulbert, and Christopher J. Lacke. All these books are Wiley publications. Prem Mann's Introductory Statistics book has been translated into Chinese, Serbian, and Portuguese. His Statistics for Business and Economics was also translated into Chinese.
1 Introduction 1 1.1 Statistics and Types of Statistics 1 Case Study 1.1 Deaths Due to Red-Light Running in the United States 3 Case Study 1.2 Is Anxiety and Depression a Major Problem Among Teens? 4 1.2 Basic Terms 5 1.3 Types of Variables 7 1.4 Types of Scales 10 1.5 Cross-Section Versus Time-Series Data 12 1.6 Population Versus Sample 13 1.7 Design of Experiments 22 1.8 Summation Notation 26 Uses and Misuses of Statistics / Glossary / Exercises / Self-Review Test / Mini-Project / Decide for ourself / Chapter 1 Technology Instructions 2 Organizing and Graphing Data 41 2.1 Organizing and Graphing Qualitative Data 42 Case Study 2.1 Confidence in Charitable and Nongovernmental Organizations 46 Case Study 2.2 Single-Payer Health-Care System Where the Federal Government Provides Coverage for Everyone 47 2.2 Organizing and Graphing Quantitative Data 48 Case Study 2.3 Average Starting Salaries of Teachers in the United States 53 Case Study 2.4 Mom, I Am Hungry 54 Case Study 2.5 How Many Cups of Coffee Do You Drink a Day? 58 2.3 Stem-and-Leaf Displays 66 2.4 Dotplots 71 Uses and Misuses of Statistics / Glossary / Exercises / Self-Review Test / Mini-Projects / Decide for Yourself / Chapter 2 Technology Instructions 3 Numerical Descriptive Measures 87 3.1 Measures of Center for Ungrouped Data 88 Case Study 3.1 Coffee Consumption Statistics 91 Case Study 3.2 Median Prices of Homes in Selected Metro Areas of the United States 94 3.2 Measures of Dispersion for Ungrouped Data 103 3.3 Mean, Variance, and Standard Deviation for Grouped Data 111 3.4 Use of Standard Deviation 117 Case Study 3.3 Does Spread Mean the Same as Variability and Dispersion? 121 3.5 Measures of Position 122 3.6 Box-and-Whisker Plot 127 Uses and Misuses of Statistics / Glossary / Exercises / Appendix 3.1 / Self-Review Test / Mini-Projects / Decide for Yourself / Chapter 3 Technology Instructions 4 Probability 147 4.1 Experiment, Outcome, and Sample Space 148 4.2 Calculating Probability 153 4.3 Marginal Probability, Conditional Probability, and Related Probability Concepts 160 Case Study 4.1 Vegetarians, Gender, and Ideology 163 4.4 Intersection of Events and the Multiplication Rule 171 4.5 Union of Events and the Addition Rule 177 4.6 Counting Rule, Factorials, Combinations, and Permutations 184 Case Study 4.2 Probability of Winning a Mega Millions Lottery Jackpot 189 Uses and Misuses of Statistics / Glossary / Exercises / Self-Review Test / Mini-Projects / Decide for Yourself / Chapter 4 Technology Instructions 5 Discrete Random Variables and Their Probability Distributions 203 5.1 Random Variables 204 5.2 Probability Distribution of a Discrete Random Variable 206 5.3 Mean and Standard Deviation of a Discrete Random Variable 212 Case Study 5.1 All State Lottery 214 5.4 The Binomial Probability Distribution 219 5.5 Negative Binomial Probability Distribution 230 5.6 The Hypergeometric Probability Distribution 234 5.7 The Poisson Probability Distribution 237 Case Study 5.2 Global Birth and Death Rates 240 Uses and Misuses of Statistics / Glossary / Exercises / Self-Review Test / Mini-Projects / Decide for Yourself / Chapter 5 Technology Instructions 6 Continuous Random Variables and the Normal Distribution 257 6.1 Continuous Probability Distribution and the Normal Probability Distribution 258 Case Study 6.1 Distribution of Time Taken to Run a Road Race 261 6.2 Standardizing a Normal Distribution 272 6.3 Applications of the Normal Distribution 278 6.4 Determining the Z and X Values When An Area Under the Normal Distribution Curve Is Known 283 6.5 The Normal Approximation to the Binomial Distribution 288 Uses and Misuses of Statistics / Glossary / Exercises /Appendix 6.1 / Self-Review Test / Mini-Projects / Decide for Yourself / Chapter 6 Technology Instructions 7 Sampling Distributions 309 7.1 Sampling Distribution, Sampling Error, and Nonsampling Errors 310 7.2 Mean and Standard Deviation of
x
315 7.3 Shape of the Sampling Distribution of
x
318 7.4 Applications _ of the Sampling Distribution of
x
324 7.5 Population and Sample Proportions; and the Mean, Standard Deviation, and Shape of the Sampling Distribution of
p
329 Case Study 7.1 2016 U.S. Election and Sampling Error 331 7.6 Applications of the Sampling Distribution of
p
336 Uses and Misuses of Statistics / Glossary / Exercises / Self- Review Test / Mini-Projects / Decide for Yourself /Chapter 7 Technology Instructions 8 Estimation of the Mean and Proportion 349 8.1 Estimation, Point Estimate, and Interval Estimate 349 8.2 Estimation of a Population Mean:
Known 353 Case Study 8.1 2019 National Average Salaries of U.S. Doctors 357 8.3 Estimation of a Population Mean:
Not Known 362 8.4 Estimation of a Population Proportion: Large Samples 370 Case Study 8.2 Is Government, Poor Leadership, or Politicians the Most Important Problem Facing the United States? 373 Uses and Misuses of Statistics / Glossary / Exercises / Self-Review Test / Mini-Projects / Decide for Yourself /Chapter 8 Technology Instructions 9 Hypothesis Tests About the Mean and Proportion 389 9.1 Hypothesis Tests: An Introduction 390 9.2 Hypothesis Tests About
:
Known 397 Case Study 9.1 Class of 2018 Average Loan Debt for U.S. Students 407 9.3 Hypothesis Tests About
:
Not Known 410 9.4 Hypothesis Tests About a Population Proportion: Large Samples 419 Case Study 9.2 Are Parents Doing Too Much for Their Adult Children? 425 Uses and Misuses of Statistics / Glossary / Exercises /Self-Review Test / Mini-Projects / Decide for Yourself / Chapter 9 Technology Instructions 10 Estimation and Hypothesis Testing: Two Populations 441 10.1 Inferences About the Difference Between Two Population Means for Independent Samples:
1 and
2Known 442 10.2 Inferences About the Difference Between Two Population Means for Independent Samples:
1 and
2 Unknown but Equal 449 10.3 Inferences About the Difference Between Two Population Means for Independent Samples:
1 and
2 Unknown and Unequal 457 10.4 Inferences About the Mean of Paired Samples (Dependent Samples) 462 10.5 Inferences About the Difference Between Two Population Proportions for Large and Independent Samples 471 Uses and Misuses of Statistics / Glossary / Exercises /Self-Review Test / Mini-Projects / Decide for Yourself /Chapter 10 Technology Instructions 11 Chi-Square Tests 497 11.1 The Chi-Square Distribution 498 11.2 A Goodness-of-Fit Test 501 Case Study 11.1 How Are the Economic Conditions in the United States Affecting the Middle Class? 507 11.3 A Test of Independence or Homogeneity 509 11.4 Inferences About the Population Variance 519 Uses and Misuses of Statistics / Glossary / Exercises /Self-Review Test / Mini-Projects / Decide for Yourself /Chapter 11 Technology Instructions 12 Analysis of Variance 537 12.1 The F Distribution 538 12.2 One-Way Analysis of Variance 540 12.3 Two-Way Analysis of Variance 550 Uses and Misuses of Statistics / Glossary / Exercises /Self-Review Test / Mini-Projects / Decide for Yourself /Chapter 12 Technology Instructions 13 Simple Linear Regression 573 13.1 Simple Linear Regression 573 Case Study 13.1 Regression of Weights on Heights for NFL Players 583 13.2 Standard Deviation of Errors and Coefficient of Determination 588 13.3 Inferences About B 594 13.4 Linear Correlation 599 13.5 Regression Analysis: A Complete Example 604 13.6 Using the Regression Model 610 Uses and Misuses of Statistics / Glossary / Exercises /Self-Review Test / Mini-Projects / Decide for Yourself /Chapter 13 Technology Instructions 14 Multiple Regression 629 14.1 Multiple Regression Analysis 629 14.2 Assumptions of the Multiple Regression Model 631 14.3 Standard Deviation of Errors 632 14.4 Coefficient of Multiple Determination 633 14.5 Computer Solution of Multiple Regression 634 Uses and Misuses of Statistics / Glossary / Self-Review Test / Mini-Project / Decide for Yourself / Chapter 14 Technology Instructions 15 Nonparametric Methods 649 This chapter is not included in this text but is available in the book's product page on www.wiley.com. 15.1 The Sign Test 650 15.2 The Wilcoxon Signed-Rank Test for Two Dependent Samples 663 15.3 The Wilcoxon Rank Sum Test for Two Independent Samples 669 15.4 The Kruskal-Wallis Test 675 15.5 The Spearman Rho Rank Correlation Coefficient Test 680 15.6 The Runs Test for Randomness 683 Uses and Misuses of Statistics / Glossary / Exercises / Self-Review Test / Mini-Projects / Decide for Yourself /Chapter 15 Technology Instructions Appendix A Explanation of Data Sets A- 1 Appendix B Statistical Tables B- 1 Appendix C Lists of Formulas C- 1 Answers to Selected Odd-numbered Exercises And Self-review Tests An- 1 Index I- 1
x
315 7.3 Shape of the Sampling Distribution of
x
318 7.4 Applications _ of the Sampling Distribution of
x
324 7.5 Population and Sample Proportions; and the Mean, Standard Deviation, and Shape of the Sampling Distribution of
p
329 Case Study 7.1 2016 U.S. Election and Sampling Error 331 7.6 Applications of the Sampling Distribution of
p
336 Uses and Misuses of Statistics / Glossary / Exercises / Self- Review Test / Mini-Projects / Decide for Yourself /Chapter 7 Technology Instructions 8 Estimation of the Mean and Proportion 349 8.1 Estimation, Point Estimate, and Interval Estimate 349 8.2 Estimation of a Population Mean:
Known 353 Case Study 8.1 2019 National Average Salaries of U.S. Doctors 357 8.3 Estimation of a Population Mean:
Not Known 362 8.4 Estimation of a Population Proportion: Large Samples 370 Case Study 8.2 Is Government, Poor Leadership, or Politicians the Most Important Problem Facing the United States? 373 Uses and Misuses of Statistics / Glossary / Exercises / Self-Review Test / Mini-Projects / Decide for Yourself /Chapter 8 Technology Instructions 9 Hypothesis Tests About the Mean and Proportion 389 9.1 Hypothesis Tests: An Introduction 390 9.2 Hypothesis Tests About
:
Known 397 Case Study 9.1 Class of 2018 Average Loan Debt for U.S. Students 407 9.3 Hypothesis Tests About
:
Not Known 410 9.4 Hypothesis Tests About a Population Proportion: Large Samples 419 Case Study 9.2 Are Parents Doing Too Much for Their Adult Children? 425 Uses and Misuses of Statistics / Glossary / Exercises /Self-Review Test / Mini-Projects / Decide for Yourself / Chapter 9 Technology Instructions 10 Estimation and Hypothesis Testing: Two Populations 441 10.1 Inferences About the Difference Between Two Population Means for Independent Samples:
1 and
2Known 442 10.2 Inferences About the Difference Between Two Population Means for Independent Samples:
1 and
2 Unknown but Equal 449 10.3 Inferences About the Difference Between Two Population Means for Independent Samples:
1 and
2 Unknown and Unequal 457 10.4 Inferences About the Mean of Paired Samples (Dependent Samples) 462 10.5 Inferences About the Difference Between Two Population Proportions for Large and Independent Samples 471 Uses and Misuses of Statistics / Glossary / Exercises /Self-Review Test / Mini-Projects / Decide for Yourself /Chapter 10 Technology Instructions 11 Chi-Square Tests 497 11.1 The Chi-Square Distribution 498 11.2 A Goodness-of-Fit Test 501 Case Study 11.1 How Are the Economic Conditions in the United States Affecting the Middle Class? 507 11.3 A Test of Independence or Homogeneity 509 11.4 Inferences About the Population Variance 519 Uses and Misuses of Statistics / Glossary / Exercises /Self-Review Test / Mini-Projects / Decide for Yourself /Chapter 11 Technology Instructions 12 Analysis of Variance 537 12.1 The F Distribution 538 12.2 One-Way Analysis of Variance 540 12.3 Two-Way Analysis of Variance 550 Uses and Misuses of Statistics / Glossary / Exercises /Self-Review Test / Mini-Projects / Decide for Yourself /Chapter 12 Technology Instructions 13 Simple Linear Regression 573 13.1 Simple Linear Regression 573 Case Study 13.1 Regression of Weights on Heights for NFL Players 583 13.2 Standard Deviation of Errors and Coefficient of Determination 588 13.3 Inferences About B 594 13.4 Linear Correlation 599 13.5 Regression Analysis: A Complete Example 604 13.6 Using the Regression Model 610 Uses and Misuses of Statistics / Glossary / Exercises /Self-Review Test / Mini-Projects / Decide for Yourself /Chapter 13 Technology Instructions 14 Multiple Regression 629 14.1 Multiple Regression Analysis 629 14.2 Assumptions of the Multiple Regression Model 631 14.3 Standard Deviation of Errors 632 14.4 Coefficient of Multiple Determination 633 14.5 Computer Solution of Multiple Regression 634 Uses and Misuses of Statistics / Glossary / Self-Review Test / Mini-Project / Decide for Yourself / Chapter 14 Technology Instructions 15 Nonparametric Methods 649 This chapter is not included in this text but is available in the book's product page on www.wiley.com. 15.1 The Sign Test 650 15.2 The Wilcoxon Signed-Rank Test for Two Dependent Samples 663 15.3 The Wilcoxon Rank Sum Test for Two Independent Samples 669 15.4 The Kruskal-Wallis Test 675 15.5 The Spearman Rho Rank Correlation Coefficient Test 680 15.6 The Runs Test for Randomness 683 Uses and Misuses of Statistics / Glossary / Exercises / Self-Review Test / Mini-Projects / Decide for Yourself /Chapter 15 Technology Instructions Appendix A Explanation of Data Sets A- 1 Appendix B Statistical Tables B- 1 Appendix C Lists of Formulas C- 1 Answers to Selected Odd-numbered Exercises And Self-review Tests An- 1 Index I- 1