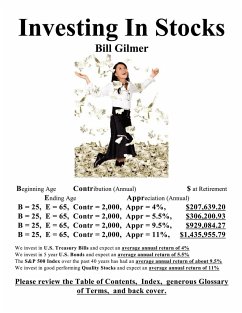
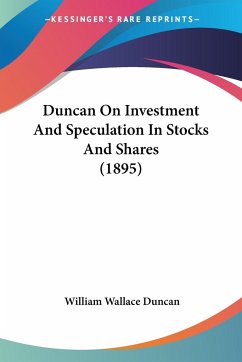
This 440 page color Presentation's $50,000 Cash portfolio began Sept 15, '02, ending Sept 12, '03, up 150% in value. The S and P 500 Index up 15%. It shows every trade, the research and reasoning. Reading this Presentation can be similar to reading an eventful mystery novel. Once a reader gets started, seeing the events in The Market, the reasoning and decisions made each of the 52 weeks, it is not easy to put it down. Seeing how $50,000 was turned into $125,000, an increase of 150% in the portfolio's value over this year's time, one week at a time, while the S and P 500 Index increased in value 15% makes very interesting reading. This portfolio, shown herein, did 10 times better than the S and P 500 Index, the standard by which Mutual Funds are judged. Most Funds have trouble doing as well as the S and P 500 Index. The data shown herein are true. Nothing was modified. If you want to Invest In Stocks and build a retirement nest-egg, you want to learn the techniques shown herein so as to hone your investment skills to do the best job you can with you precious valuable Investment Capital. You also want to be able to quickly recognize The Mood of The Market so you can respond ASAP to either get in or lighten up and conserve your Capital. This was illustrated twice in this Presentation's year. During these quiet, uncertain, or down market periods, the Investment Capital is invested in a Stock that pays monthly an annual dividend rate of over 12%, still growing when The Market is faltering or failing. Learning what is presented here can be a Smart Investment if used correctly.
Hinweis: Dieser Artikel kann nur an eine deutsche Lieferadresse ausgeliefert werden.
Hinweis: Dieser Artikel kann nur an eine deutsche Lieferadresse ausgeliefert werden.

