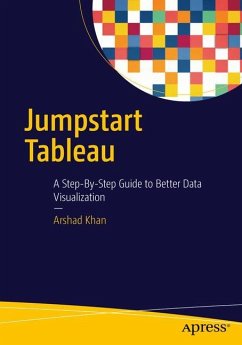
Learn how to create powerful data visualizations easily and quickly. You will develop reports and queries, and perform data analysis.
Jumpstart Tableau covers the basic reporting and analysis functions that most BI users perform in their day-to-day work. These include connecting to a data source, working with dimensions and measures, developing reports and charts, saving workbooks, filtering, swapping, sorting, formatting, grouping, creating hierarchies, forecasting, exporting, distributing, as well developing various chart types.
Each exercise in Jumpstart Tableau provides screenshots that cover every step from start to finish. The exercises are based on a comprehensive sample Excel-based data source that Tableau Software (version 9) has provided, which makes it very easy to duplicate the exercises on the real software.
This book teaches you to:
Execute each function in a step-by-step mannerWork up to more advanced and complex Tableau functionalityIntegrate individual development of content, such as tables/charts and visualizations., onto a dashboard for an effective presentationWhat You'll Learn
Connect to data sourcesDevelop reportsCreate visualizationsPerform analysis functions (e.g., filtering, drilldown, sorting, grouping, forecasting, etc.)Save visualizations in different formats and distribute themDevelop dashboards and their content
Who This Book Is For
Novice Tableau users, BI end users, as well as developers and business analysts. Also, students in university courses on dashboards and data visualization as well as BI and data analysis can quickly get up to speed with Tableau tools and use them for implementing the hands-on projects associated with these courses.

