Schade – dieser Artikel ist leider ausverkauft. Sobald wir wissen, ob und wann der Artikel wieder verfügbar ist, informieren wir Sie an dieser Stelle.
- Broschiertes Buch
- Merkliste
- Auf die Merkliste
- Bewerten Bewerten
- Teilen
- Produkt teilen
- Produkterinnerung
- Produkterinnerung
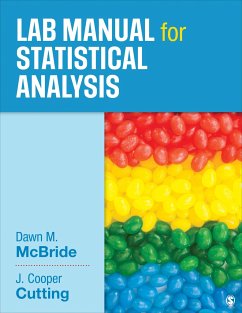
Packed full of useful exercises, checklists, and how-to sections, this robust lab manual gives students hands-on guidance and practice analyzing their own psychological research.
Andere Kunden interessierten sich auch für
![Psychology Psychology]() James S NairnePsychology225,99 €
James S NairnePsychology225,99 €![Brain & Behavior Brain & Behavior]() Bob GarrettBrain & Behavior227,99 €
Bob GarrettBrain & Behavior227,99 €![Essentials of Psychology Essentials of Psychology]() Saul KassinEssentials of Psychology225,99 €
Saul KassinEssentials of Psychology225,99 €![Statistical Power Analysis with Missing Data Statistical Power Analysis with Missing Data]() Adam DaveyStatistical Power Analysis with Missing Data69,99 €
Adam DaveyStatistical Power Analysis with Missing Data69,99 €![Statistical Testing with jamovi Psychology Statistical Testing with jamovi Psychology]() Statistical Testing with jamovi Psychology53,99 €
Statistical Testing with jamovi Psychology53,99 €![Reviews of Human Factors and Ergonomics Reviews of Human Factors and Ergonomics]() Reviews of Human Factors and Ergonomics207,99 €
Reviews of Human Factors and Ergonomics207,99 €
Packed full of useful exercises, checklists, and how-to sections, this robust lab manual gives students hands-on guidance and practice analyzing their own psychological research.
Produktdetails
- Produktdetails
- Verlag: Sage Publications
- Seitenzahl: 128
- Erscheinungstermin: 4. Oktober 2017
- Englisch
- Abmessung: 282mm x 216mm x 10mm
- Gewicht: 259g
- ISBN-13: 9781506325170
- ISBN-10: 1506325173
- Artikelnr.: 48033094
- Herstellerkennzeichnung
- Libri GmbH
- Europaallee 1
- 36244 Bad Hersfeld
- gpsr@libri.de
Dawn M. McBride is professor of psychology at Illinois State University, where she has taught research methods since 1998. Her research interests include automatic forms of memory, false memory, prospective memory, task order choices, and forgetting. In addition to research methods, she teaches courses in introductory psychology, cognition and learning, and human memory; she also teaches a graduate course in experimental design. She is a recipient of the Illinois State University Teaching Initiative Award and the Illinois State University SPA/Psi Chi Jim Johnson Award for commitment to undergraduate mentorship, involvement, and achievement. Her nonacademic interests include spending time with her family, traveling, watching Philadelphia sports teams (it was a good year for Philly sports this year!), and reading British murder mysteries. She earned her PhD in cognitive psychology from the University of California, Irvine, and her BA from the University of California, Los Angeles.
Preface
Introduction for Students
Section 1. Topic Activities
1. Statistics in the Media
2. The Purpose of Statistics
3. Understanding Your Data
4. Research Concepts: Designs, Validity, and Scales of Measurement
5. Measurement Group Activity
6. Designing an Experiment Group Activity
7. Experimental Variables
8. Distributions and Probability
9. Displaying Distributions
10. Setting Up Your Data in SPSS: Creating a Data File
11. Displaying Distributions in SPSS
12. Basic Probability
13. Sampling
14. Central Tendency 1
15. Central Tendency 2
16. Central Tendency in SPSS
17. Describing a Distribution by Hand
18. More Describing Distributions
19. Descriptive Statistics Exercise
20. Descriptive Statistics With Excel
21. Measures of Variability in SPSS
22. Calculating z Scores Using SPSS
23. The Normal Distribution
24. z Scores and the Normal Distribution
25. Hypothesis Testing With Normal Populations
26. Stating Hypotheses and Choosing Tests
27. Hypothesis Testing With z Tests
28. Hypothesis Testing With a Single Sample
29. One-Sample t Test in SPSS
30. One-Sample t Tests by Hand
31. Related Samples t Tests
32. Related Samples t Test in SPSS
33. Independent Samples t Tests
34. Hypothesis Testing: Multiple Tests
35. More Hypothesis Tests With Multiple Tests
36. t Tests Summary Worksheet
37. Choose the Correct t Test
38. One-Way Between-Subjects ANOVA by Hand
39. One-Way Between-Subjects ANOVA in SPSS
40. Factorial ANOVA
41. One-Way Within-Subjects ANOVA
42. One-Way Within-Subjects ANOVA in SPSS
43. ANOVA Review
44. Which Test Should I Use?
45. Correlations and Scatterplots Exercise
46. Correlations and Scatterplots 2
47. Correlations and Scatterplots in SPSS
48. Computing Correlations by Hand
49. Computing Correlations by Hand 2
50. Hypothesis Testing With Correlation
51. Hypothesis Testing With Correlation Using SPSS
52. Regression
53. Chi-Square Test for Independence
Section 2. Meet the Formulae
54. Meet the Formula: Standard Deviation
55. Meet the Formula: z Score Transformation
56. Meet the Formula: Single-Sample z Tests and t Tests
57. Meet the Formula: Comparing Independent Samples and Related Samples t
Tests
58. Meet the Formula: One-Factor Between-Subjects ANOVA
59. Meet the Formula: Two-Factor ANOVA
60. Meet the Formula: One-Factor Within-Subjects ANOVA
61. Meet the Formula: Correlation
62. Meet the Formula: Bivariate Regression
Section 3. Data Analysis Projects
63. Data Analysis Exercise: von Hippel, Ronay, Baker, Kjelsaas, and Murphy
(2016)
64. Data Analysis Exercise: Nairne, Pandeirada, and Thompson (2008)
65. Data Analysis Project 1: Crammed Versus Distributed Study
66. Data Analysis Project 2: Teaching Techniques Study
67. Data Analysis Project 3: Distracted Driving Study
68. Data Analysis Project 4: Temperature and Air Quality Study
69. Data Analysis Project 5: Job Type and Satisfaction Study
70. Data Analysis Project 6: Attractive Face Recognition Study
71. Data Analysis Project 7: Discrimination in the Workplace Study
Section 4. How to Choose a Statistical Test
72. Using the Flowchart to Find the Correct Statistical Test
73. More Using the Flowchart to Find the Correct Statistical Test
74. Research Design Exercise
75. Design and Data Collection Exercise
76. Designs and Analyses
Section 5. Describing and Interpreting Results in APA Style
77. Writing a Results Section From SPSS Output: t Tests
78. Writing a Results Section From SPSS Output: ANOVA
79. Interpreting Results Exercise: Sproesser, Schupp, and Renner (2014)
80. Interpreting Results Exercise: Ravizza, Uitvlugt, and Fenn (2017)
Appendix: Summary of Formulae
References


