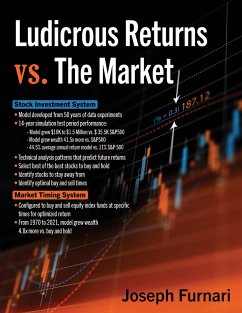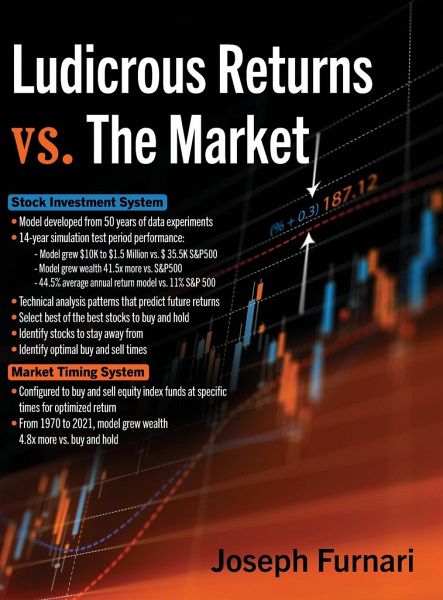
Ludicrous Returns vs. the Market

PAYBACK Punkte
35 °P sammeln!
Are you an individual investor or money manager investing for clients? Have you been frustrated to earn a lower annual return than S&P500 index? Have you ever had the desire to earn more than S&P500 market rate of return? Did you ever wish you had a solid investment tool that objectively identifies the best investments and when to buy or sell? Ludicrous Returns vs. the Market shares two investment models developed to outperform the market over the long term: a stock investment model and a market timing model. Both models are based on technical analysis, analyzing past stock price patterns to m...
Are you an individual investor or money manager investing for clients? Have you been frustrated to earn a lower annual return than S&P500 index? Have you ever had the desire to earn more than S&P500 market rate of return? Did you ever wish you had a solid investment tool that objectively identifies the best investments and when to buy or sell? Ludicrous Returns vs. the Market shares two investment models developed to outperform the market over the long term: a stock investment model and a market timing model. Both models are based on technical analysis, analyzing past stock price patterns to make an inference on how it will perform in the future. To develop the stock investment model, analysis and data experiments were conducted on hundreds of stock price charts over a 50-year time frame. Stock price patterns found to consistently predict the future were transformed into the model logic. In a 2007 to 2020 simulation test, the stock investment model earned an average annual return of 44.5% and grew cumulative capital 41.5 times the S&P 500! Before discovering patterns that predict the future, Joe Furnari would have been one to preach that no one has been able to successfully earn above an average market rate of return timing the market over the long-term. However, after the stock model predictive pattern discoveries, Joe Furnari conducted a plethora analysis on a mission to find predictive patterns that could be developed into a market timing model. The market timing model developed is based on buying and selling S&P500 index at optimal times. 1970 - 2021 test period result: timing model grew capital 4.8x more than buying and holding S&P500 index! One reason why the market timing model outperforms buy and hold is the model will move out of equities and into cash before a lot of significant crashes and then back to equities before a solid run-up. Some example market corrections of successful market timing execution include 1973 - 1974, Oct - Nov 1979, March 1980, October 1987, 2000 - 2001, 2007-2009, August 2011, 2015, 2018, and February - March 2020.


