A hands-on guide to making valuable decisions from data using advanced data mining methods and techniques This second installment in the Making Sense of Data series continues to explore a diverse range of commonly used approaches to making and communicating decisions from data. Delving into more technical topics, this book equips readers with advanced data mining methods that are needed to successfully translate raw data into smart decisions across various fields of research including business, engineering, finance, and the social sciences. Following a comprehensive introduction that details…mehr
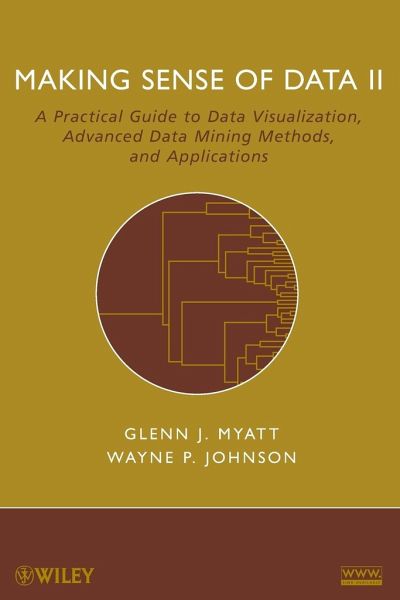
A hands-on guide to making valuable decisions from data using advanced data mining methods and techniques This second installment in the Making Sense of Data series continues to explore a diverse range of commonly used approaches to making and communicating decisions from data. Delving into more technical topics, this book equips readers with advanced data mining methods that are needed to successfully translate raw data into smart decisions across various fields of research including business, engineering, finance, and the social sciences. Following a comprehensive introduction that details how to define a problem, perform an analysis, and deploy the results, Making Sense of Data II addresses the following key techniques for advanced data analysis: * Data Visualization reviews principles and methods for understanding and communicating data through the use of visualization including single variables, the relationship between two or more variables, groupings in data, and dynamic approaches to interacting with data through graphical user interfaces. * Clustering outlines common approaches to clustering data sets and provides detailed explanations of methods for determining the distance between observations and procedures for clustering observations. Agglomerative hierarchical clustering, partitioned-based clustering, and fuzzy clustering are also discussed. * Predictive Analytics presents a discussion on how to build and assess models, along with a series of predictive analytics that can be used in a variety of situations including principal component analysis, multiple linear regression, discriminate analysis, logistic regression, and Naïve Bayes. * Applications demonstrates the current uses of data mining across a wide range of industries and features case studies that illustrate the related applications in real-world scenarios. Each method is discussed within the context of a data mining process including defining the problem and deploying the results, and readers are provided with guidance on when and how each method should be used. The related Web site for the series (www.makingsenseofdata.com) provides a hands-on data analysis and data mining experience. Readers wishing to gain more practical experience will benefit from the tutorial section of the book in conjunction with the TraceisTM software, which is freely available online. With its comprehensive collection of advanced data mining methods coupled with tutorials for applications in a range of fields, Making Sense of Data II is an indispensable book for courses on data analysis and data mining at the upper-undergraduate and graduate levels. It also serves as a valuable reference for researchers and professionals who are interested in learning how to accomplish effective decision making from data and understanding if data analysis and data mining methods could help their organization.Hinweis: Dieser Artikel kann nur an eine deutsche Lieferadresse ausgeliefert werden.
Glenn J. Myatt, PhD, is cofounder of Leadscope, Inc. and a Partner of Myatt & Johnson, Inc., a consulting company that focuses on business intelligence application development delivered through the Internet. Dr. Myatt is the author of Making Sense of Data: A Practical Guide to Exploratory Data Analysis and Data Mining, also published by Wiley. WAYNE P. JOHNSON, MSc., is cofounder of Leadscope, Inc. and a Partner of Myatt & Johnson, Inc. Mr. Johnson has over two decades of experience in the design and development of large software systems, and his current professional interests include human-computer interaction, information visualization, and methodologies for contextual inquiry.
Inhaltsangabe
PREFACE xi 1 INTRODUCTION 1 1.1 Overview 1 1.2 Definition 1 1.3 Preparation 2 1.3.1 Overview 2 1.3.2 Accessing Tabular Data 3 1.3.3 Accessing Unstructured Data 3 1.3.4 Understanding the Variables and Observations 3 1.3.5 Data Cleaning 6 1.3.6 Transformation 7 1.3.7 Variable Reduction 9 1.3.8 Segmentation 10 1.3.9 Preparing Data to Apply 10 1.4 Analysis 11 1.4.1 Data Mining Tasks 11 1.4.2 Optimization 12 1.4.3 Evaluation 12 1.4.4 Model Forensics 13 1.5 Deployment 13 1.6 Outline of Book 14 1.6.1 Overview 14 1.6.2 Data Visualization 14 1.6.3 Clustering 15 1.6.4 Predictive Analytics 15 1.6.5 Applications 16 1.6.6 Software 16 1.7 Summary 16 1.8 Further Reading 17 2 DATA VISUALIZATION 19 2.1 Overview 19 2.2 Visualization Design Principles 20 2.2.1 General Principles 20 2.2.2 Graphics Design 23 2.2.3 Anatomy of a Graph 28 2.3 Tables 32 2.3.1 Simple Tables 32 2.3.2 Summary Tables 33 2.3.3 Two-Way Contingency Tables 34 2.3.4 Supertables 34 2.4 Univariate Data Visualization 36 2.4.1 Bar Chart 36 2.4.2 Histograms 37 2.4.3 Frequency Polygram 41 2.4.4 Box Plots 41 2.4.5 Dot Plot 43 2.4.6 Stem-and-Leaf Plot 44 2.4.7 Quantile Plot 46 2.4.8 Quantile-Quantile Plot 48 2.5 Bivariate Data Visualization 49 2.5.1 Scatterplot 49 2.6 Multivariate Data Visualization 50 2.6.1 Histogram Matrix 52 2.6.2 Scatterplot Matrix 54 2.6.3 Multiple Box Plot 56 2.6.4 Trellis Plot 56 2.7 Visualizing Groups 59 2.7.1 Dendrograms 59 2.7.2 Decision Trees 60 2.7.3 Cluster Image Maps 60 2.8 Dynamic Techniques 63 2.8.1 Overview 63 2.8.2 Data Brushing 64 2.8.3 Nearness Selection 65 2.8.4 Sorting and Rearranging 65 2.8.5 Searching and Filtering 65 2.9 Summary 65 2.10 Further Reading 66 3 CLUSTERING 67 3.1 Overview 67 3.2 Distance Measures 75 3.2.1 Overview 75 3.2.2 Numeric Distance Measures 77 3.2.3 Binary Distance Measures 79 3.2.4 Mixed Variables 84 3.2.5 Other Measures 86 3.3 Agglomerative Hierarchical Clustering 87 3.3.1 Overview 87 3.3.2 Single Linkage 88 3.3.3 Complete Linkage 92 3.3.4 Average Linkage 93 3.3.5 Other Methods 96 3.3.6 Selecting Groups 96 3.4 Partitioned-Based Clustering 98 3.4.1 Overview 98 3.4.2 k-Means 98 3.4.3 Worked Example 100 3.4.4 Miscellaneous Partitioned-Based Clustering 101 3.5 Fuzzy Clustering 103 3.5.1 Overview 103 3.5.2 Fuzzy k-Means 103 3.5.3 Worked Examples 104 3.6 Summary 109 3.7 Further Reading 110 4 PREDICTIVE ANALYTICS 111 4.1 Overview 111 4.1.1 Predictive Modeling 111 4.1.2 Testing Model Accuracy 116 4.1.3 Evaluating Regression Models' Predictive Accuracy 117 4.1.4 Evaluating Classification Models' Predictive Accuracy 119 4.1.5 Evaluating Binary Models' Predictive Accuracy 120 4.1.6 ROC Charts 122 4.1.7 Lift Chart 124 4.2 Principal Component Analysis 126 4.2.1 Overview 126 4.2.2 Principal Components 126 4.2.3 Generating Principal Components 127 4.2.4 Interpretation of Principal Components 128 4.3 Multiple Linear Regression 130 4.3.1 Overview 130 4.3.2 Generating Models 133 4.3.3 Prediction 136 4.3.4 Analysis of Residuals 136 4.3.5 Standard Error 139 4.3.6 Coefficient of Multiple Determination 140 4.3.7 Testing the Model Significance 142 4.3.8 Selecting and Transforming Variables 143 4.4 Discriminant Analysis 145 4.4.1 Overview 145 4.4.2 Discriminant Function 146 4.4.3 Discriminant Analysis Example 146 4.5 Logistic Regression 151 4.5.1 Overview 151 4.5.2 Logistic Regression Formula 151 4.5.3 Estimating Coefficients 153 4.5.4 Assessing and Optimizing Results 156 4.6 Naive Bayes Classifiers 157 4.6.1 Overview 157 4.6.2 Bayes Theorem and the Independence Assumption 158 4.6.3 Independence Assumption 158 4.6.4 Classification Process 159 4.7 Summary 161 4.8 Further Reading 163 5 APPLICATIONS 165 5.1 Overview 165 5.2 Sales and Marketing 166 5.3 Industry-Specific Data Mining 169 5.3.1 Finance 169 5.3.2 Insurance 171 5.3.3 Retail 172 5.3.4 Telecommunications 173 5.3.5 Manufacturing 174 5.3.6 Entertainment 175 5.3.7 Government 176 5.3.8 Pharmaceuticals 177 5.3.9 Healthcare 179 5.4 microRNA Data Analysis Case Study 181 5.4.1 Defining the Problem 181 5.4.2 Preparing the Data 181 5.4.3 Analysis 183 5.5 Credit Scoring Case Study 192 5.5.1 Defining the Problem 192 5.5.2 Preparing the Data 192 5.5.3 Analysis 199 5.5.4 Deployment 203 5.6 Data Mining Nontabular Data 203 5.6.1 Overview 203 5.6.2 Data Mining Chemical Data 203 5.6.3 Data Mining Text 210 5.7 Further Reading 213 APPENDIX A MATRICES 215 A.1 Overview of Matrices 215 A.2 Matrix Addition 215 A.3 Matrix Multiplication 216 A.4 Transpose of a Matrix 217 A.5 Inverse of a Matrix 217 APPENDIX B SOFTWARE 219 B.1 Software Overview 219 B.1.1 Software Objectives 219 B.1.2 Access and Installation 221 B.1.3 User Interface Overview 221 B.2 Data Preparation 223 B.2.1 Overview 223 B.2.2 Reading in Data 224 B.2.3 Searching the Data 225 viii CONTENTS B.2.4 Variable Characterization 227 B.2.5 Removing Observations and Variables 228 B.2.6 Cleaning the Data 228 B.2.7 Transforming the Data 230 B.2.8 Segmentation 235 B.2.9 Principal Component Analysis 236 B.3 Tables and Graphs 238 B.3.1 Overview 238 B.3.2 Contingency Tables 239 B.3.3 Summary Tables 240 B.3.4 Graphs 242 B.3.5 Graph Matrices 246 B.4 Statistics 246 B.4.1 Overview 246 B.4.2 Descriptive Statistics 248 B.4.3 Confidence Intervals 248 B.4.4 Hypothesis Tests 249 B.4.5 Chi-Square Test 250 B.4.6 ANOVA 251 B.4.7 Comparative Statistics 251 B.5 Grouping 253 B.5.1 Overview 253 B.5.2 Clustering 254 B.5.3 Associative Rules 257 B.5.4 Decision Trees 258 B.6 Prediction 261 B.6.1 Overview 261 B.6.2 Linear Regression 263 B.6.3 Discriminant Analysis 265 B.6.4 Logistic Regression 266 B.6.5 Naive Bayes 267 B.6.6 kNN 269 B.6.7 CART 269 B.6.8 Neural Networks 270 B.6.9 Apply Model 271 BIBLIOGRAPHY 273 INDEX 279
Rezensionen
?Experts, researchers, practitioners, or readers who need a quickreference or who want to get up to speed quickly on data analysiswill love having a copy of this work. Summing Up: Highlyrecommended.? (CHOICE, October 2009)
Es gelten unsere Allgemeinen Geschäftsbedingungen: www.buecher.de/agb
Impressum
www.buecher.de ist ein Internetauftritt der buecher.de internetstores GmbH
Geschäftsführung: Monica Sawhney | Roland Kölbl | Günter Hilger
Sitz der Gesellschaft: Batheyer Straße 115 - 117, 58099 Hagen
Postanschrift: Bürgermeister-Wegele-Str. 12, 86167 Augsburg
Amtsgericht Hagen HRB 13257
Steuernummer: 321/5800/1497
USt-IdNr: DE450055826