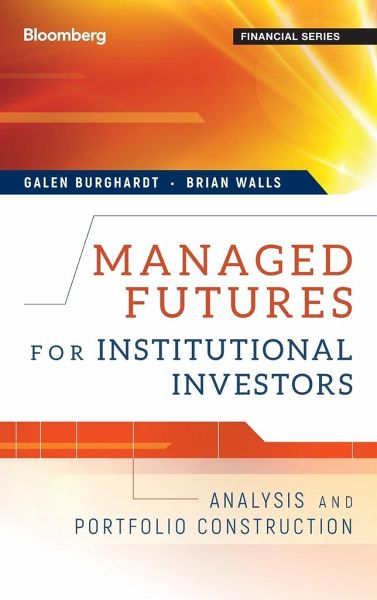
MANAGED FUTURES are an essential part of the investment industry. Within this arena, managed futures professionals--also known as Commodity Trading Advisors (CTAs)--actively manage client assets using global futures and other derivative securities. Authors Galen Burghardt and Brian Walls--part of Newedge USA, a global multi-asset brokerage firm based out of Chicago--have extensive experience in the managed futures space, and now, with Managed Futures for Institutional Investors, they address the issues that will allow you to gain a firm understanding of this field and improve the performance…mehr
MANAGED FUTURES are an essential part of the investment industry. Within this arena, managed futures professionals--also known as Commodity Trading Advisors (CTAs)--actively manage client assets using global futures and other derivative securities. Authors Galen Burghardt and Brian Walls--part of Newedge USA, a global multi-asset brokerage firm based out of Chicago--have extensive experience in the managed futures space, and now, with Managed Futures for Institutional Investors, they address the issues that will allow you to gain a firm understanding of this field and improve the performance of your portfolios through the use of CTAs. Divided into three comprehensive parts, the book opens with a detailed discussion of how this specific industry works. Here, everything from cash management practices and calculating a rate of return on something that has no net liquidating value is covered. You'll also gain insights on the most common vehicles for investing in CTAs, including funds, platforms, and managed accounts. Part Two, Building Blocks, offers some informative answers to the tough questions surrounding CTAs. Throughout this section, Burghardt and Walls touch on a number of topics, such as how trend following works and what active management of CTA investments really costs. Along the way, they also show how to put a CTA's drawdown experience in perspective and take a close look at how the single most important source of volatility in world financial markets affects the relationship between stock returns and CTA returns. Rounding out this in-depth look at CTAs and managed futures, Part Three, Portfolio Construction, examines how the predictability of volatility and correlation can be used to build portfolios that into the things that will help, and hinder, you in creating a well-diversified portfolio. They also show how to identify low correlation reliably and where the past, in fact, does reveal something useful about the future. Using futures as part of any actively managed portfolio is essential. This reliable guide offers a practical look at what CTAs and futures are all about, and how they can be used to evaluate and meet risk, return, and liquidity objectives.Hinweis: Dieser Artikel kann nur an eine deutsche Lieferadresse ausgeliefert werden.
GALEN BURGHARDT is Director of Research for Newedge USA, LLC, a joint venture between Calyon and Société Générale. He is the lead author of The Treasury Bond Basis and The Eurodollar Futures and Options Handbook, which are standard texts for users of financial futures. He was an adjunct professor of finance in the University of Chicago's Graduate School of Business (now the Booth School). He was the head of financial research for the Chicago Mercantile Exchange, and gained access to the world of futures through his work in the Capital Markets Section of the Federal Reserve Board. His PhD in economics is from the University of Washington in Seattle. BRIAN WALLS is the Global Head of Research at Newedge Prime Brokerage, the foremost provider of brokerage services to the managed futures industry. He has worked in the financial services industry for thirty years in the various capacities of trading, operations, management, and research. He was a pioneer of capital introduction services and is a sought after and trusted advisor to many Commodity Trading Advisors, global macro managers, fund of funds and institutional investors. He is the chairman of the Newedge Index Committee.
Inhaltsangabe
Acknowledgments xiii Introduction: Why Invest in CTAs? 1 What Kind of Hedge Fund Is a CTA? 1 Why Do CTAs Make Money? 2 How Much Should You Invest? 7 What About the Risks? 9 They're a Good Fit for Institutional Investors 10 How the Book Is Structured 11 Part I: A Practical Guide to the Industry Chapter 1 Understanding Returns 17 Risk and Cash Management 18 Trading, Funding, and Notional Levels 19 The Stability of Return Volatilities 19 Basic Futures Mechanics 20 A Typical Futures Portfolio 27 Chapter 2 Where Are the Data? 41 The CTA Universe and Your Range of Choices 42 The Fluid Composition of a Database 44 How Backfilled Data Can Mislead 46 Trading Programs and Lengths of Track Records 48 Returns Net of Fees and Share Classes 49 Sources of Data for Indexes of CTA Performance 50 Chapter 3 Structuring Your Investment: Frequently Asked Questions 53 How Many Managers Should You Choose? 55 What Are CTA Funds? 58 What Are Multi-CTA Funds? 60 What Are Managed Accounts? 62 What Are Platforms? 66 How Do You Compare and Contrast These Offerings? 66 Who Regulates CTAs? 68 How Are Structured Notes and Total Return Swaps Used by CTA Investors? 69 What Are the Account Opening Procedures for a Managed Account? 69 What Is the Minimum Investment in a CTA? 71 What Does It Mean When a Manager Is Closed? 71 What Are the Subscription Procedures for a Fund? 71 Conclusion 72 Part II: Building Blocks Chapter 4 How Trend Following Works 75 The Two Basic Strategies 76 Making the Systems Work in Practice 79 Transactions Costs 87 Other Considerations 87 Case Study: Two Models from 1994-2003 89 Rates of Return and Leverage 94 Commodities and Capacity Constraints 94 Market Environment and Give-Backs 97 Chapter 5 Two Benchmarks for Momentum Trading 99 Data and the Trend-Following Sub-Index 101 Trend-Following Models 108 Laying the Groundwork for Analyzing Returns to Trend Following 108 Constructing a Portfolio 110 Simplifying Assumptions 114 How Did the Models Do? 115 The Newedge Trend Indicator 124 Next Steps 124 Chapter 6 The Value of Daily Return Data 129 How Good Are Daily Data? 130 Estimating Return Volatility 138 Distributions of Estimated Volatility 139 Beware a False Sense of Confidence 145 What If Underlying Returns Are Highly Skewed? 146 Effect on Drawdown Distributions 148 Chapter 7 Every Drought Ends in a Rainstorm: Mean Reversion, Momentum, or Serial Independence? 151 A Focus on Conditional Returns 152 The Costs of Being Wrong about Timing Investments Can Be Substantial 152 The Data 153 The Test Tally 155 Test for Serial Dependence: Autocorrelation 156 Test for Serial Dependence: Runs 163 Conditional Return Distributions 165 Conclusion 175 Chapter 8 Understanding Drawdowns 181 Drawdown Defined 182 What Should They Look Like? 183 What Forces Shape the Distributions? 184 The Distribution of All Drawdowns 185 The Distribution of Maximum Drawdowns 187 The Core Drawdown Function 190 Empirical Drawdown Distributions 192 Reconciling Theoretical and Empirical Distributions 192 Putting a Manager's Experience in Perspective 197 What about Future Drawdowns? 198 Further Questions 199 Chapter 9 How Stock Price Volatility Affects Returns 201 A Look at Historical Returns 202 Stock Price Volatility and Returns on the S&P 500 203 S&P 500 Volatility Dominates Market Volatility 206 CTA Returns, Correlations, and Volatility 210 Conclusion 215 Chapter 10 The Costs of Active Management 217 Forgone Loss Carry-Forward 217 Liquidation and Reinvestment 220 Other Costs 224 Conclusion 225 Chapter 11 Measuring Market Impact and Liquidity 227 A Very Fat Data Set 229 A Representative Market Maker 234 Fitting the Curve to the Data 237 Hidden Liquidity 238 Estimating the Risk-Aversion Parameter 243 Volume, Volatility, and Market Impact Profiles 243 Where Do We Go from Here? 246 Appendix 247 Part III: Portfolio Construction Chapter 12 Superstars versus Teamwork 253 The Contribution of Low Correlation to Portfolio Performance 255 How Reliable Are Correlation Estimates? 256 The Contest 262 Dropping and Adding Managers 270 The Value of Incremental Knowledge about Return Distributions 275 The Costs of Dropping and Adding Managers 277 Chapter 13 A New Look at Constructing Teamwork Portfolios 279 Why Look Back? 281 A Fresh Look at the Original Research 282 Two New Approaches 287 Comparing the Four Approaches 291 Reviewing the Results 296 Chapter 14 Correlations and Holding Periods: The Research Basis for the Newedge AlternativeEdge Short-Term Traders Index 297 Review of Previous Research 298 Index Methodology and Construction 304 How Low Are the Correlations? 305 Why Are the Correlations Low? 308 Holding Period and Return Correlation 308 Why Are There Not More Short-Term Traders? 313 Replicating the Index 314 Cautions and Managing the Index 316 Conclusion 316 Appendix 316 Chapter 15 "There Are Known Unknowns": The Drag of Imperfect Estimates 319 Improving Risk-Adjusted Returns 321 Throwing Out the Losers 331 Due Diligence and Evaluation 338 Bibliography 341 About the Authors 343 Index 345
Es gelten unsere Allgemeinen Geschäftsbedingungen: www.buecher.de/agb
Impressum
www.buecher.de ist ein Internetauftritt der buecher.de internetstores GmbH
Geschäftsführung: Monica Sawhney | Roland Kölbl | Günter Hilger
Sitz der Gesellschaft: Batheyer Straße 115 - 117, 58099 Hagen
Postanschrift: Bürgermeister-Wegele-Str. 12, 86167 Augsburg
Amtsgericht Hagen HRB 13257
Steuernummer: 321/5800/1497
USt-IdNr: DE450055826