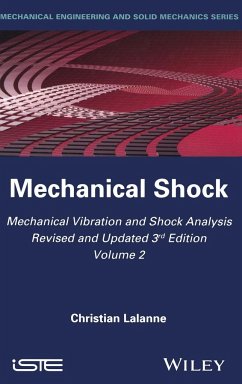
Christian Lalanne
Mechanical Vibration and Shock Analysis, Mechanical Shock
Christian Lalanne
Mechanical Vibration and Shock Analysis, Mechanical Shock
- Gebundenes Buch
- Merkliste
- Auf die Merkliste
- Bewerten Bewerten
- Teilen
- Produkt teilen
- Produkterinnerung
- Produkterinnerung
Revision of: Mechanical vibration and shock analysis / Christian Lalanne. Second edition. London: ISTE Ltd; Hoboken, NJ: John Wiley & Sons, Inc., 2009.
Andere Kunden interessierten sich auch für
![Mechanical Vibration and Shock Analysis, Fatigue Damage Mechanical Vibration and Shock Analysis, Fatigue Damage]() Christian LalanneMechanical Vibration and Shock Analysis, Fatigue Damage213,99 €
Christian LalanneMechanical Vibration and Shock Analysis, Fatigue Damage213,99 €![Mechanical Vibration and Shock Analysis, Random Vibration Mechanical Vibration and Shock Analysis, Random Vibration]() Christian LalanneMechanical Vibration and Shock Analysis, Random Vibration213,99 €
Christian LalanneMechanical Vibration and Shock Analysis, Random Vibration213,99 €![Hilbert Transform Applications in Mechanical Vibration Hilbert Transform Applications in Mechanical Vibration]() Michael FeldmanHilbert Transform Applications in Mechanical Vibration138,99 €
Michael FeldmanHilbert Transform Applications in Mechanical Vibration138,99 €![The Rayleigh-Ritz Method for Structural Analysis The Rayleigh-Ritz Method for Structural Analysis]() Sinniah IlankoThe Rayleigh-Ritz Method for Structural Analysis164,99 €
Sinniah IlankoThe Rayleigh-Ritz Method for Structural Analysis164,99 €![Propagation of Sound in Porous Media Propagation of Sound in Porous Media]() Jean AllardPropagation of Sound in Porous Media149,99 €
Jean AllardPropagation of Sound in Porous Media149,99 €![Iutam Symposium on Nonlinear Analysis of Fracture Iutam Symposium on Nonlinear Analysis of Fracture]() J R WillisIutam Symposium on Nonlinear Analysis of Fracture60,99 €
J R WillisIutam Symposium on Nonlinear Analysis of Fracture60,99 €![Toughening Mechanisms in Quasi-Brittle Materials Toughening Mechanisms in Quasi-Brittle Materials]() S.P. Shah (ed.)Toughening Mechanisms in Quasi-Brittle Materials223,99 €
S.P. Shah (ed.)Toughening Mechanisms in Quasi-Brittle Materials223,99 €-
-
-
Revision of: Mechanical vibration and shock analysis / Christian Lalanne. Second edition. London: ISTE Ltd; Hoboken, NJ: John Wiley & Sons, Inc., 2009.
Produktdetails
- Produktdetails
- Verlag: Wiley
- 3rd Volume 2 edition
- Seitenzahl: 464
- Erscheinungstermin: 12. Mai 2014
- Englisch
- Abmessung: 235mm x 157mm x 29mm
- Gewicht: 808g
- ISBN-13: 9781848216457
- ISBN-10: 1848216459
- Artikelnr.: 40055255
- Herstellerkennzeichnung
- Libri GmbH
- Europaallee 1
- 36244 Bad Hersfeld
- gpsr@libri.de
Christian Lalanne is a Consultant Engineer who previously worked as an expert at the French Atomic Energy Authority and who has specialized in the study of vibration and shock for more than 40 years. He has been associated with the new methods of drafting testing specifications and associated informatic tools.
Foreword to Series xiii Introduction xvii List of Symbols xix Chapter 1. Shock Analysis 1 1.1. Definitions 1 1.1.1. Shock 1 1.1.2. Transient signal 2 1.1.3. Jerk 3 1.1.4. Simple (or perfect) shock 3 1.1.5. Half-sine shock 3 1.1.6. Versed sine (or haversine) shock 4 1.1.7. Terminal peak sawtooth (TPS) shock (or final peak sawtooth FPS)) 5 1.1.8. Initial peak sawtooth (IPS) shock 6 1.1.9. Square shock 7 1.1.10. Trapezoidal shock 8 1.1.11. Decaying sinusoidal pulse 8 1.1.12. Bump test 9 1.1.13. Pyroshock 9 1.2. Analysis in the time domain 12 1.3. Temporal moments 12 1.4. Fourier transform 15 1.4.1. Definition 15 1.4.2. Reduced Fourier transform 17 1.4.3. Fourier transforms of simple shocks 17 1.4.4. What represents the Fourier transform of a shock? 29 1.4.5. Importance of the Fourier transform 31 1.5. Energy spectrum 32 1.5.1. Energy according to frequency 32 1.5.2. Average energy spectrum 33 1.6. Practical calculations of the Fourier transform 33 1.6.1. General 33 1.6.2. Case: signal not yet digitized 33 1.6.3. Case: signal already digitized 36 1.6.4. Adding zeros to the shock signal before the calculation of its Fourier transform 37 1.6.5. Windowing 40 1.7. The interest of time-frequency analysis 41 1.7.1. Limit of the Fourier transform 41 1.7.2. Short term Fourier transform (STFT) 44 1.7.3. Wavelet transform 49 Chapter 2. Shock Response Spectrum 55 2.1. Main principles 55 2.2. Response of a linear one-degree-of-freedom system 59 2.2.1. Shock defined by a force 59 2.2.2. Shock defined by an acceleration 60 2.2.3. Generalization 60 2.2.4. Response of a one-degree-of-freedom system to simple shocks 65 2.3. Definitions 69 2.3.1. Response spectrum 69 2.3.2. Absolute acceleration SRS 69 2.3.3. Relative displacement shock spectrum 70 2.3.4. Primary (or initial) positive SRS 70 2.3.5. Primary (or initial) negative SRS 70 2.3.6. Secondary (or residual) SRS 71 2.3.7. Positive (or maximum positive) SRS 71 2.3.8. Negative (or maximum negative) SRS 71 2.3.9. Maximax SRS 72 2.4. Standardized response spectra 73 2.4.1. Definition 73 2.4.2. Half-sine pulse 75 2.4.3. Versed sine pulse 76 2.4.4. Terminal peak sawtooth pulse 78 2.4.5. Initial peak sawtooth pulse 79 2.4.6. Square pulse 81 2.4.7. Trapezoidal pulse 81 2.5. Choice of the type of SRS 82 2.6. Comparison of the SRS of the usual simple shapes 83 2.7. SRS of a shock defined by an absolute displacement of the support 84 2.8. Influence of the amplitude and the duration of the shock on its SRS 84 2.9. Difference between SRS and extreme response spectrum (ERS) 86 2.10. Algorithms for calculation of the SRS 86 2.11. Subroutine for the calculation of the SRS 86 2.12. Choice of the sampling frequency of the signal 90 2.13. Example of use of the SRS 94 2.14. Use of SRS for the study of systems with several degrees of freedom 96 2.15. Damage boundary curve 100 Chapter 3. Properties of Shock Response Spectra 103 3.1. Shock response spectra domains 103 3.2. Properties of SRS at low frequencies 104 3.2.1. General properties 104 3.2.2. Shocks with zero velocity change 104 3.2.3. Shocks with
V = 0 and
D
0 at the end of a pulse 115 3.2.4. Shocks with
V = 0 and
D = 0 at the end of a pulse 117 3.2.5. Notes on residual spectrum 120 3.3. Properties of SRS at high frequencies 121 3.4. Damping influence 124 3.5. Choice of damping 124 3.6. Choice of frequency range 127 3.7. Choice of the number of points and their distribution 128 3.8. Charts 131 3.9. Relation of SRS with Fourier spectrum 134 3.9.1. Primary SRS and Fourier transform 134 3.9.2. Residual SRS and Fourier transform 136 3.9.3. Comparison of the relative severity of several shocks using their Fourier spectra and their shock response spectra 139 3.10. Care to be taken in the calculation of the spectra 143 3.10.1. Main sources of errors 143 3.10.2. Influence of background noise of the measuring equipment 143 3.10.3. Influence of zero shift 145 3.11. Specific case of pyroshocks 152 3.11.1. Acquisition of the measurements 152 3.11.2. Examination of the signal before calculation of the SRS 154 3.11.3. Examination of the SRS 155 3.12. Pseudo-velocity shock spectrum 156 3.12.1. Hunt's relationship 156 3.12.2. Interest of PVSS 160 3.13. Use of the SRS for pyroshocks 162 3.14. Other propositions of spectra165 3.14.1. Pseudo-velocity calculated from the energy transmitted 165 3.14.2. Pseudo-velocity from the "input" energy at the end of a shock 165 3.14.3. Pseudo-velocity from the unit "input" energy 167 3.14.4. SRS of the "total" energy 167 Chapter 4. Development of Shock Test Specifications 175 4.1. Introduction 175 4.2. Simplification of the measured signal 176 4.3. Use of shock response spectra 178 4.3.1. Synthesis of spectra 178 4.3.2. Nature of the specification 180 4.3.3. Choice of shape 181 4.3.4. Amplitude 182 4.3.5. Duration 182 4.3.6. Difficulties 186 4.4. Other methods 187 4.4.1. Use of a swept sine 188 4.4.2. Simulation of SRS using a fast swept sine 189 4.4.3. Simulation by modulated random noise 193 4.4.4. Simulation of a shock using random vibration 194 4.4.5. Least favorable response technique 195 4.4.6. Restitution of an SRS by a series of modulated sine pulses 196 4.5. Interest behind simulation of shocks on shaker using a shock spectrum 198 Chapter 5. Kinematics of Simple Shocks 203 5.1. Introduction 203 5.2. Half-sine pulse 203 5.2.1. General expressions of the shock motion 203 5.2.2. Impulse mode 206 5.2.3. Impact mode 207 5.3. Versed sine pulse 216 5.4. Square pulse 218 5.5. Terminal peak sawtooth pulse 221 5.6. Initial peak sawtooth pulse 223 Chapter 6. Standard Shock Machines 225 6.1. Main types 225 6.2. Impact shock machines 227 6.3. High impact shock machines 237 6.3.1. Lightweight high impact shock machine 237 6.3.2. Medium weight high impact shock machine 238 6.4. Pneumatic machines 239 6.5. Specific testing facilities 241 6.6. Programmers 242 6.6.1. Half-sine pulse 242 6.6.2. TPS shock pulse 250 6.6.3. Square pulse
trapezoidal pulse 258 6.6.4. Universal shock programmer 258 Chapter 7. Generation of Shocks Using Shakers 267 7.1. Principle behind the generation of a signal with a simple shape versus time 267 7.2. Main advantages of the generation of shock using shakers 268 7.3. Limitations of electrodynamic shakers 269 7.3.1. Mechanical limitations 269 7.3.2. Electronic limitations 271 7.4. Remarks on the use of electrohydraulic shakers 271 7.5. Pre- and post-shocks 271 7.5.1. Requirements 271 7.5.2. Pre-shock or post-shock 273 7.5.3. Kinematics of the movement for symmetric pre- and post-shock 276 7.5.4. Kinematics of the movement for a pre-shock or a post-shock alone 286 7.5.5. Abacuses 288 7.5.6. Influence of the shape of pre- and post-pulses 289 7.5.7. Optimized pre- and post-shocks 292 7.6. Incidence of pre- and post-shocks on the quality of simulation 297 7.6.1. General 297 7.6.2. Influence of the pre- and post-shocks on the time history response of a one-degree-of-freedom system 297 7.6.3. Incidence on the shock response spectrum 300 Chapter 8. Control of a Shaker Using a Shock Response Spectrum 303 8.1. Principle of control using a shock response spectrum 303 8.1.1. Problems 303 8.1.2. Parallel filter method 304 8.1.3. Current numerical methods 305 8.2. Decaying sinusoid 310 8.2.1. Definition 310 8.2.2. Response spectrum 311 8.2.3. Velocity and displacement 314 8.2.4. Constitution of the total signal 315 8.2.5. Methods of signal compensation 316 8.2.6. Iterations 323 8.3. D.L. Kern and C.D. Hayes' function 324 8.3.1. Definition 324 8.3.2. Velocity and displacement 325 8.4. ZERD function 326 8.4.1. Definition 326 8.4.2. Velocity and displacement 328 8.4.3. Comparison of ZERD waveform with standard decaying sinusoid 330 8.4.4. Reduced response spectra 330 8.5. WAVSIN waveform 332 8.5.1. Definition 332 8.5.2. Velocity and displacement 333 8.5.3. Response of a one-degree-of-freedom system 335 8.5.4. Response spectrum 338 8.5.5. Time history synthesis from shock spectrum 339 8.6. SHOC waveform 340 8.6.1. Definition 340 8.6.2. Velocity and displacement 342 8.6.3. Response spectrum 343 8.6.4. Time history synthesis from shock spectrum 345 8.7. Comparison of WAVSIN, SHOC waveforms and decaying sinusoid 346 8.8. Waveforms based on the cosm(x) window 346 8.9. Use of a fast swept sine 348 8.10. Problems encountered during the synthesis of the waveforms 351 8.11. Criticism of control by SRS 353 8.12. Possible improvements 357 8.12.1. IES proposal 357 8.12.2. Specification of a complementary parameter 358 8.12.3. Remarks on the properties of the response spectrum 363 8.13. Estimate of the feasibility of a shock specified by its SRS363 8.13.1. C.D. Robbins and E.P. Vaughan's method 363 8.13.2. Evaluation of the necessary force, power and stroke 365 Chapter 9. Simulation of Pyroshocks 371 9.1. Simulations using pyrotechnic facilities 371 9.2. Simulation using metal to metal impact 375 9.3. Simulation using electrodynamic shakers 377 9.4. Simulation using conventional shock machines 378 Appendix. Similitude in Mechanics 381 A1. Conservation of materials 381 A2. Conservation of acceleration and stress 383 Mechanical Shock Tests: A Brief Historical Background 385 Bibliography 387 Index 407 Summary of other Volumes in the series 413
V = 0 and
D
0 at the end of a pulse 115 3.2.4. Shocks with
V = 0 and
D = 0 at the end of a pulse 117 3.2.5. Notes on residual spectrum 120 3.3. Properties of SRS at high frequencies 121 3.4. Damping influence 124 3.5. Choice of damping 124 3.6. Choice of frequency range 127 3.7. Choice of the number of points and their distribution 128 3.8. Charts 131 3.9. Relation of SRS with Fourier spectrum 134 3.9.1. Primary SRS and Fourier transform 134 3.9.2. Residual SRS and Fourier transform 136 3.9.3. Comparison of the relative severity of several shocks using their Fourier spectra and their shock response spectra 139 3.10. Care to be taken in the calculation of the spectra 143 3.10.1. Main sources of errors 143 3.10.2. Influence of background noise of the measuring equipment 143 3.10.3. Influence of zero shift 145 3.11. Specific case of pyroshocks 152 3.11.1. Acquisition of the measurements 152 3.11.2. Examination of the signal before calculation of the SRS 154 3.11.3. Examination of the SRS 155 3.12. Pseudo-velocity shock spectrum 156 3.12.1. Hunt's relationship 156 3.12.2. Interest of PVSS 160 3.13. Use of the SRS for pyroshocks 162 3.14. Other propositions of spectra165 3.14.1. Pseudo-velocity calculated from the energy transmitted 165 3.14.2. Pseudo-velocity from the "input" energy at the end of a shock 165 3.14.3. Pseudo-velocity from the unit "input" energy 167 3.14.4. SRS of the "total" energy 167 Chapter 4. Development of Shock Test Specifications 175 4.1. Introduction 175 4.2. Simplification of the measured signal 176 4.3. Use of shock response spectra 178 4.3.1. Synthesis of spectra 178 4.3.2. Nature of the specification 180 4.3.3. Choice of shape 181 4.3.4. Amplitude 182 4.3.5. Duration 182 4.3.6. Difficulties 186 4.4. Other methods 187 4.4.1. Use of a swept sine 188 4.4.2. Simulation of SRS using a fast swept sine 189 4.4.3. Simulation by modulated random noise 193 4.4.4. Simulation of a shock using random vibration 194 4.4.5. Least favorable response technique 195 4.4.6. Restitution of an SRS by a series of modulated sine pulses 196 4.5. Interest behind simulation of shocks on shaker using a shock spectrum 198 Chapter 5. Kinematics of Simple Shocks 203 5.1. Introduction 203 5.2. Half-sine pulse 203 5.2.1. General expressions of the shock motion 203 5.2.2. Impulse mode 206 5.2.3. Impact mode 207 5.3. Versed sine pulse 216 5.4. Square pulse 218 5.5. Terminal peak sawtooth pulse 221 5.6. Initial peak sawtooth pulse 223 Chapter 6. Standard Shock Machines 225 6.1. Main types 225 6.2. Impact shock machines 227 6.3. High impact shock machines 237 6.3.1. Lightweight high impact shock machine 237 6.3.2. Medium weight high impact shock machine 238 6.4. Pneumatic machines 239 6.5. Specific testing facilities 241 6.6. Programmers 242 6.6.1. Half-sine pulse 242 6.6.2. TPS shock pulse 250 6.6.3. Square pulse
trapezoidal pulse 258 6.6.4. Universal shock programmer 258 Chapter 7. Generation of Shocks Using Shakers 267 7.1. Principle behind the generation of a signal with a simple shape versus time 267 7.2. Main advantages of the generation of shock using shakers 268 7.3. Limitations of electrodynamic shakers 269 7.3.1. Mechanical limitations 269 7.3.2. Electronic limitations 271 7.4. Remarks on the use of electrohydraulic shakers 271 7.5. Pre- and post-shocks 271 7.5.1. Requirements 271 7.5.2. Pre-shock or post-shock 273 7.5.3. Kinematics of the movement for symmetric pre- and post-shock 276 7.5.4. Kinematics of the movement for a pre-shock or a post-shock alone 286 7.5.5. Abacuses 288 7.5.6. Influence of the shape of pre- and post-pulses 289 7.5.7. Optimized pre- and post-shocks 292 7.6. Incidence of pre- and post-shocks on the quality of simulation 297 7.6.1. General 297 7.6.2. Influence of the pre- and post-shocks on the time history response of a one-degree-of-freedom system 297 7.6.3. Incidence on the shock response spectrum 300 Chapter 8. Control of a Shaker Using a Shock Response Spectrum 303 8.1. Principle of control using a shock response spectrum 303 8.1.1. Problems 303 8.1.2. Parallel filter method 304 8.1.3. Current numerical methods 305 8.2. Decaying sinusoid 310 8.2.1. Definition 310 8.2.2. Response spectrum 311 8.2.3. Velocity and displacement 314 8.2.4. Constitution of the total signal 315 8.2.5. Methods of signal compensation 316 8.2.6. Iterations 323 8.3. D.L. Kern and C.D. Hayes' function 324 8.3.1. Definition 324 8.3.2. Velocity and displacement 325 8.4. ZERD function 326 8.4.1. Definition 326 8.4.2. Velocity and displacement 328 8.4.3. Comparison of ZERD waveform with standard decaying sinusoid 330 8.4.4. Reduced response spectra 330 8.5. WAVSIN waveform 332 8.5.1. Definition 332 8.5.2. Velocity and displacement 333 8.5.3. Response of a one-degree-of-freedom system 335 8.5.4. Response spectrum 338 8.5.5. Time history synthesis from shock spectrum 339 8.6. SHOC waveform 340 8.6.1. Definition 340 8.6.2. Velocity and displacement 342 8.6.3. Response spectrum 343 8.6.4. Time history synthesis from shock spectrum 345 8.7. Comparison of WAVSIN, SHOC waveforms and decaying sinusoid 346 8.8. Waveforms based on the cosm(x) window 346 8.9. Use of a fast swept sine 348 8.10. Problems encountered during the synthesis of the waveforms 351 8.11. Criticism of control by SRS 353 8.12. Possible improvements 357 8.12.1. IES proposal 357 8.12.2. Specification of a complementary parameter 358 8.12.3. Remarks on the properties of the response spectrum 363 8.13. Estimate of the feasibility of a shock specified by its SRS363 8.13.1. C.D. Robbins and E.P. Vaughan's method 363 8.13.2. Evaluation of the necessary force, power and stroke 365 Chapter 9. Simulation of Pyroshocks 371 9.1. Simulations using pyrotechnic facilities 371 9.2. Simulation using metal to metal impact 375 9.3. Simulation using electrodynamic shakers 377 9.4. Simulation using conventional shock machines 378 Appendix. Similitude in Mechanics 381 A1. Conservation of materials 381 A2. Conservation of acceleration and stress 383 Mechanical Shock Tests: A Brief Historical Background 385 Bibliography 387 Index 407 Summary of other Volumes in the series 413

