- Gebundenes Buch
- Merkliste
- Auf die Merkliste
- Bewerten Bewerten
- Teilen
- Produkt teilen
- Produkterinnerung
- Produkterinnerung
A unique approach to understanding the foundations of statistical quality control with a focus on the latest developments in nonparametric control charting methodologies Statistical Process Control (SPC) methods have a long and successful history and have revolutionized many facets of industrial production around the world. This book addresses recent developments in statistical process control bringing the modern use of computers and simulations along with theory within the reach of both the researchers and practitioners. The emphasis is on the burgeoning field of nonparametric SPC (NSPC) and…mehr
Andere Kunden interessierten sich auch für
![Nonparametric Statistical Methods, Solutions Manual Nonparametric Statistical Methods, Solutions Manual]() Myles HollanderNonparametric Statistical Methods, Solutions Manual66,99 €
Myles HollanderNonparametric Statistical Methods, Solutions Manual66,99 €![Nonparametric Inference Nonparametric Inference]() Zakkula GovindarajuluNonparametric Inference261,99 €
Zakkula GovindarajuluNonparametric Inference261,99 €![Nonparametric Regression and Spline Smoothing Nonparametric Regression and Spline Smoothing]() Randall L EubankNonparametric Regression and Spline Smoothing197,99 €
Randall L EubankNonparametric Regression and Spline Smoothing197,99 €![Simple Statistical Tests for Geography Simple Statistical Tests for Geography]() Danny MccarrollSimple Statistical Tests for Geography258,99 €
Danny MccarrollSimple Statistical Tests for Geography258,99 €![Nonparametric Methods in Statistics Nonparametric Methods in Statistics]() Nonparametric Methods in Statistics38,99 €
Nonparametric Methods in Statistics38,99 €![Handbook of Parametric and Nonparametric Statistical Procedures, Fifth Edition Handbook of Parametric and Nonparametric Statistical Procedures, Fifth Edition]() David J SheskinHandbook of Parametric and Nonparametric Statistical Procedures, Fifth Edition321,99 €
David J SheskinHandbook of Parametric and Nonparametric Statistical Procedures, Fifth Edition321,99 €![An Introduction to Nonparametric Statistics An Introduction to Nonparametric Statistics]() John E KolassaAn Introduction to Nonparametric Statistics126,99 €
John E KolassaAn Introduction to Nonparametric Statistics126,99 €-
-
-
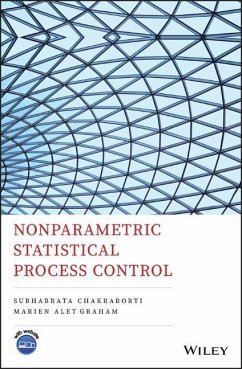
A unique approach to understanding the foundations of statistical quality control with a focus on the latest developments in nonparametric control charting methodologies Statistical Process Control (SPC) methods have a long and successful history and have revolutionized many facets of industrial production around the world. This book addresses recent developments in statistical process control bringing the modern use of computers and simulations along with theory within the reach of both the researchers and practitioners. The emphasis is on the burgeoning field of nonparametric SPC (NSPC) and the many new methodologies developed by researchers worldwide that are revolutionizing SPC. Over the last several years research in SPC, particularly on control charts, has seen phenomenal growth. Control charts are no longer confined to manufacturing and are now applied for process control and monitoring in a wide array of applications, from education, to environmental monitoring, to disease mapping, to crime prevention. This book addresses quality control methodology, especially control charts, from a statistician's viewpoint, striking a careful balance between theory and practice. Although the focus is on the newer nonparametric control charts, the reader is first introduced to the main classes of the parametric control charts and the associated theory, so that the proper foundational background can be laid. * Reviews basic SPC theory and terminology, the different types of control charts, control chart design, sample size, sampling frequency, control limits, and more * Focuses on the distribution-free (nonparametric) charts for the cases in which the underlying process distribution is unknown * Provides guidance on control chart selection, choosing control limits and other quality related matters, along with all relevant formulas and tables * Uses computer simulations and graphics to illustrate concepts and explore the latest research in SPC Offering a uniquely balanced presentation of both theory and practice, Nonparametric Methods for Statistical Quality Control is a vital resource for students, interested practitioners, researchers, and anyone with an appropriate background in statistics interested in learning about the foundations of SPC and latest developments in NSPC.
Hinweis: Dieser Artikel kann nur an eine deutsche Lieferadresse ausgeliefert werden.
Hinweis: Dieser Artikel kann nur an eine deutsche Lieferadresse ausgeliefert werden.
Produktdetails
- Produktdetails
- Verlag: Wiley
- Seitenzahl: 448
- Erscheinungstermin: 29. April 2019
- Englisch
- Abmessung: 246mm x 173mm x 25mm
- Gewicht: 839g
- ISBN-13: 9781118456033
- ISBN-10: 1118456033
- Artikelnr.: 51385310
- Herstellerkennzeichnung
- Libri GmbH
- Europaallee 1
- 36244 Bad Hersfeld
- gpsr@libri.de
- Verlag: Wiley
- Seitenzahl: 448
- Erscheinungstermin: 29. April 2019
- Englisch
- Abmessung: 246mm x 173mm x 25mm
- Gewicht: 839g
- ISBN-13: 9781118456033
- ISBN-10: 1118456033
- Artikelnr.: 51385310
- Herstellerkennzeichnung
- Libri GmbH
- Europaallee 1
- 36244 Bad Hersfeld
- gpsr@libri.de
SUBHABRATA CHAKRABORTI, PHD is Professor of Statistics and Morrow Faculty Excellence Fellow at the University of Alabama, Tuscaloosa, AL , USA. He is a Fellow of the American Statistical Association and an elected member of the International Statistical Institute. Professor Chakraborti has contributed in a number of research areas, including censored data analysis and income inference. His current research interests include development of statistical methods in general and nonparametric methods in particular for statistical process control. He has been a Fulbright Senior Scholar to South Africa and a visiting professor in several countries, including India, Holland and Brazil. Cited for his mentoring and collaborative work with students and scholars from around the world, Professor Chakraborti has presented seminars, delivered keynote/plenary addresses and conducted research workshops at various conferences. MARIEN ALET GRAHAM, PHD is a senior lecturer at the Department of Science, Mathematics and Technology Education at the University of Pretoria, Pretoria, South Africa. She holds an Y1 rating from the South African National Research Foundation (NRF). Her current research interests are in Statistical Process Control, Nonparametric Statistics and Statistical Education. She has published several articles in international peer review journals and presented her work at various conferences.
About the Authors xiii
Preface xv
About the companion website xix
1 Background/Review of Statistical Concepts 1
Chapter Overview 1
1.1 Basic Probability 1
1.2 Random Variables and Their Distributions 3
1.3 Random Sample 12
1.4 Statistical Inference 16
1.5 Role of the Computer 22
2 Basics of Statistical Process Control 23
Chapter Overview 23
2.1 Basic Concepts 23
2.1.1 Types of Variability 23
2.1.2 The Control Chart 25
2.1.3 Construction of Control Charts 29
2.1.4 Variables and Attributes Control Charts 30
2.1.5 Sample Size or Subgroup Size 31
2.1.6 Rational Subgrouping 31
2.1.7 Nonparametric or Distribution-free 34
2.1.8 Monitoring Process Location and/or Process Scale 36
2.1.9 Case K and Case U 37
2.1.10 Control Charts and Hypothesis Testing 37
2.1.11 General Steps in Designing a Control Chart 39
2.1.12 Measures of Control Chart Performance 39
2.1.12.1 False Alarm Probability (FAP) 41
2.1.12.2 False Alarm Rate (FAR) 43
2.1.12.3 The Average Run-length (ARL) 43
2.1.12.4 Standard Deviation of Run-length (SDRL) 44
2.1.12.5 Percentiles of Run-length 44
2.1.12.6 Average Number of Samples to Signal (ANSS) 48
2.1.12.7 Average Number of Observations to Signal (ANOS) 48
2.1.12.8 Average Time to Signal (ATS) 48
2.1.12.9 Number of Individual Items Inspected (I) 49
2.1.13 Operating Characteristic Curves (OC-curves) 50
2.1.14 Design of Control Charts 51
2.1.14.1 Sample Size, Sampling Frequency, and Variable Sample Sizes 51
2.1.14.2 Variable Control Limits 54
2.1.14.3 Standardized Control Limits 56
2.1.15 Size of a Shift 57
2.1.16 Choice of Control Limits 59
2.1.16.1 k-sigma Limits 59
2.1.16.2 Probability Limits 60
3 Parametric Univariate Variables Control Charts 63
Chapter Overview 63
3.1 Introduction 64
3.2 Parametric Variables Control Charts in Case K 64
3.2.1 Shewhart Control Charts 65
3.2.2 CUSUM Control Charts 67
3.2.3 EWMA Control Charts 72
3.3 Types of Parametric Variables Charts in Case K: Illustrative Examples
77
3.3.1 Shewhart Control Charts 77
3.3.1.1 Shewhart Control Charts for Monitoring Process Mean 77
3.3.1.2 Shewhart Control Charts for Monitoring Process Variation 79
3.3.2 CUSUM Control Charts 84
3.3.3 EWMA Control Charts 87
3.4 Shewhart, EWMA, and CUSUM Charts: Which to Use When 90
3.5 Control Chart Enhancements 91
3.5.1 Sensitivity Rules 91
3.5.2 Runs-type Signaling Rules 95
3.5.2.1 Signaling Indicators 97
3.6 Run-length Distribution in the Specified Parameter Case (Case K) 110
3.6.1 Methods of Calculating the Run-length Distribution 110
3.6.1.1 The Exact Approach (for Shewhart and some Shewhart-type Charts) 110
3.6.1.2 The Markov Chain Approach 111
3.6.1.3 The Integral Equation Approach 128
3.6.1.4 The Computer Simulations (the Monte Carlo) Approach 128
3.7 Parameter Estimation Problem and Its Effects on the Control Chart
Performance 131
3.8 Parametric Variables Control Charts in Case U 133
3.8.1 Shewhart Control Charts in Case U 133
3.8.1.1 Shewhart Control Charts for the Mean in Case U 133
3.8.1.2 Shewhart Control Charts for the Standard Deviation in Case U 134
3.8.2 CUSUM Chart for the Mean in Case U 137
3.8.3 EWMA Chart for the Mean in Case U 137
3.9 Types of Parametric Control Charts in Case U: Illustrative Examples 138
3.9.1 Charts for the Mean 138
3.9.2 Charts for the Standard Deviation 141
3.9.2.1 Using the Estimator Sp 144
3.10 Run-length Distribution in the unknown Parameter Case (Case U) 153
3.10.1 Methods of Calculating the Run-length Distribution and Its
Properties: The Conditioning/Unconditioning Method 153
3.10.1.1 The Shewhart Chart for the Mean in Case U 153
3.10.1.2 The Shewhart Chart for the Variance in Case U 169
3.10.1.3 The CUSUM Chart for the Mean in Case U 170
3.10.1.4 The EWMA Chart for the Mean in Case U 171
3.11 Control Chart Enhancements 172
3.11.1 Run-length Calculation for Runs-type Signaling Rules in Case U 172
3.12 Phase I Control Charts 174
3.12.1 Phase I X-chart 174
3.13 Size of Phase I Data 176
3.14 Robustness of Parametric Control Charts 177
Appendix 3.1 Some Derivations for the EWMA Control Chart 178
Appendix 3.2 Markov Chains 180
Appendix 3.3 Some Derivations for the Shewhart Dispersion Charts 184
4 Nonparametric (Distribution-free) Univariate Variables Control Charts 187
Chapter Overview 187
4.1 Introduction 187
4.2 Distribution-free Variables Control Charts in Case K 189
4.2.1 Shewhart Control Charts 189
4.2.1.1 Shewhart Control Charts Based on Signs 189
4.2.1.2 Shewhart Control Charts Based on Signed-ranks 196
4.2.2 CUSUM Control Charts 202
4.2.2.1 CUSUM Control Charts Based on Signs 202
4.2.2.2 A CUSUM Sign Control Chart with Runs-type Signaling Rules 203
4.2.2.3 Methods of Calculating the Run-length Distribution 203
4.2.2.4 CUSUM Control Charts Based on Signed-ranks 205
4.2.3 EWMA Control Charts 208
4.2.3.1 EWMA Control Charts Based on Signs 208
4.2.3.2 EWMA Control Charts Based on Signs with Runs-type Signaling Rules
210
4.2.3.3 Methods of Calculating the Run-length Distribution 210
4.2.3.4 EWMA Control Charts Based on Signed-ranks 214
4.2.3.5 An EWMA-SR control chart with runs-type signaling rules 216
4.2.3.6 Methods of Calculating the Run-length Distribution 216
4.3 Distribution-free Control Charts in Case K: Illustrative Examples 219
4.3.1 Shewhart Control Charts 219
4.3.2 CUSUM Control Charts 229
4.3.3 EWMA Control Charts 243
4.4 Distribution-free Variables Control Charts in Case U 253
4.4.1 Shewhart Control Charts 254
4.4.1.1 Shewhart Control Charts Based on the Precedence Statistic 254
4.4.1.2 Shewhart Control Charts Based on the Mann-Whitney Test Statistic
275
4.4.2 CUSUM Control Charts 281
4.4.2.1 CUSUM Control Charts Based on the Exceedance Statistic 281
4.4.2.2 CUSUM Control Charts Based on the Wilcoxon Rank-sum Statistic 285
4.4.3 EWMA Control Charts 287
4.4.3.1 EWMA Control Charts Based on the Exceedance Statistic 287
4.4.3.2 EWMA Control Charts Based on the Wilcoxon Rank-sum Statistic 290
4.5 Distribution-free Control Charts in Case U: Illustrative Examples 293
4.5.1 Shewhart Control Charts 293
4.5.2 CUSUM Control Charts 295
4.5.3 EWMA Control Charts 302
4.6 Effects of Parameter Estimation 307
4.7 Size of Phase I Data 307
4.8 Control Chart Enhancements 308
4.8.1 Sensitivity and Runs-type Signaling Rules 308
Appendix 4.1 Shewhart Control Charts 311
Appendix 4.1.1 The Shewhart-Prec Control Chart 311
Appendix 4.2 CUSUM Control Charts 312
Appendix 4.2.1 The CUSUM-EX Control Chart 312
Appendix 4.2.2 The CUSUM-rank Control Chart 314
Appendix 4.3 EWMA Control Charts 317
Appendix 4.3.1 The EWMA-SN Control Chart 317
Appendix 4.3.2 The EWMA-SR Control Chart 318
Appendix 4.3.3 The EWMA-EX Control Chart 319
Appendix 4.3.4 The EWMA-rank Control Chart 323
5 Miscellaneous Univariate Distribution-free (Nonparametric) Variables
Control Charts 325
Chapter Overview 325
5.1 Introduction 325
5.2 Other Univariate Distribution-free (Nonparametric) Variables Control
Charts 326
5.2.1 Phase I Control Charts 326
5.2.1.1 Introduction 326
5.2.1.2 Phase I Control Charts for Location 331
5.2.2 Special Cases of Precedence Charts 343
5.2.2.1 The Min Chart 343
5.2.2.2 The CUMIN Chart 346
5.2.3 Control Charts Based on Bootstrapping 348
5.2.3.1 Methodology 351
5.2.4 Change-point Models 353
5.2.5 Some Adaptive Charts 357
5.2.5.1 Introduction 357
5.2.5.2 Variable Sampling Interval (VSI) and Variable Sample Size (VSS)
Charts 358
5.2.5.3 Other Adaptive Schemes 359
5.2.5.4 Properties and Performance Measures of Adaptive Charts 360
5.2.5.5 Adaptive Nonparametric Control Charts 362
Appendix A Tables 369
Appendix B Programmes 381
References 413
Index 425

