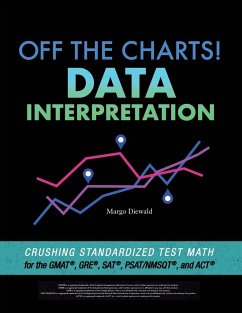
Off the Charts! Data Interpretation is like having a best friend who happens to be really, really good at explaining everything you need to figure out how to get better at solving those word problems about charts and graphs. Imagine if your friend could teach you how to recognize and adapt to any curve balls the test maker tries to sneak in to make a question really difficult. Build up your ability to interpret data that is presented visually. Each of the major standardized tests has increased its emphasis on questions which require you to consistently do three things well: Interpret the wording of the question correctly, so you know exactly what information you need to obtain from the data visualization. Interpret the data visualization correctly, so you retrieve the correct information from it. Setup the right equations so you can perform the right calculations, when applicable, on the numbers you retrieved from the data visualization. You will learn to efficiently arrive at the right answer, every time. In this book, you will find: A set of structured-but-flexible approaches which can be combined in different ways to solve even the hardest questions. Sample questions are asked in a variety of ways to enhance your ability to work with simple and complex tables, charts, and graphs. Refresher content presented in ways which accelerate your learning and improve your retention of related facts, relationships, and formulas.
Hinweis: Dieser Artikel kann nur an eine deutsche Lieferadresse ausgeliefert werden.
Hinweis: Dieser Artikel kann nur an eine deutsche Lieferadresse ausgeliefert werden.


